Figures & data
Figure 1. Effects of perturbations of Pfn1 on mammosphere forming ability of MDA-231 cells. (A, D) Representative images of mammosphere formation by GFP control vs GFP-Pfn1 overexpressers (A) and control- vs Pfn1 shRNA expressers (D) of MDA-231 cells (scale bars – 200 μm). (B, C, E, F) Bar graphs (B, E) and pie charts (C, F) summarize the number and the size distribution of MDA-231 mammospheres, respectively, in overexpression and knockdown settings of Pfn1. Data summarized from 3 independent experiments and values are presented as mean ± SD; **p < 0.01; ***:p < 0.001).
Figure 2. Effects of perturbations of Pfn1 on CSC gene expression signature in MDA-231 cells. (A-B) Cluster diagrams depicting differentially expressed (fold-change cut-off = 1.5; p-value < 0.05) CSC-related genes in response to overexpression (A) and knockdown (B) of Pfn1 expression in MDA-231 cells, based on the readouts of qPCR array. The tables alongside display the fold-change of each differentially expressed gene (data summarized from 3 independent experiments). (C) Immunoblot analyses of STAT3 and MUC1 expression from whole cell lysates of control vs Pfn1 knockdown and GFP vs GFP-Pfn1 overexpressing MDA-231 cells (tubulin blot serves as the loading control). The multiple bands of MUC1 represent proteins with different degrees of glycosylation.
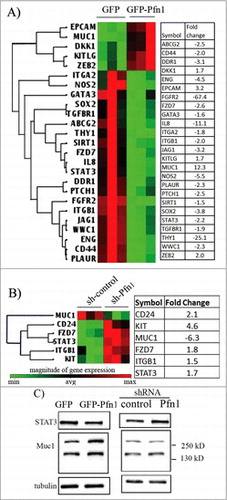
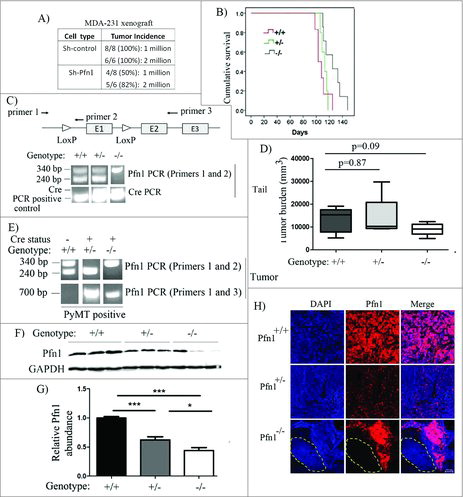
Figure 3. Effect of loss of Pfn1 on tumorigenicity in MDA-231 xenograft and MMTV:PyMT breast cancer models. (A) A table showing primary mammary tumor induction frequency following orthotopic inoculation of sh-control vs sh-Pfn1 MDA-231 cells in nude mice. (B) Top panel: A schematic diagram showing the positioning of lox sites in Pfn1flox/flox mouse with respect to the exons (indicated by E1, E2 and E3) and the PCR primers used for genotyping (primers 1 and 2) and confirmation of allele excision (primers 1 and 3) in PyMT+ mice of various Pfn1 genotypes. bottom panel: Pfn1- and Cre PCRs performed with tail-clip DNA. (C) A Kaplan-Meier curve showing relative survival of PyMT+ mice of various Pfn1 genotypes (survival was measured based on the number of days for largest tumor to reach 2.0 cm in size). (D) A bar graph showing the average tumor burden in PyMT+ mice of various Pfn1 genotypes. (E) Pfn1 PCRs performed with tumor-derived DNA (240 bp: wild-type (WT) allele amplicon, 340 bp: floxed allele amplicon, 700 bp: excision-specific amplicon). Note that all Cre-negative mice were considered to be Pfn1+/+ regardless of the nature of Pfn1 alleles (WT/flox, flox/flox, WT/WT). (F-G) A representative immunoblot depicting (F) and a bar graph summarizing (G) the relative Pfn1 expressions in PyMT tumors of the indicated Pfn1 genotypes. Three random tumors were analyzed per genotype; GAPDH immunoblot served as the loading control (data summarized from a pool of 18 random tumor samples from 6 animals of each genotype). (H) Representative IHC images PyMT mammary tumors of the indicated Pfn1 genotypes (Pfn1: red; DAPI: blue) reveal mosaic Pfn1 staining in Pfn1−/− tumors (the area outlined by a dashed line represents a region of the tumor comprised of Pfn1-null cells; bar -100 μm). Values are presented as mean ± SD (*p < 0.05, ***p < 0.001).