Figures & data
Figure 1. TH inhibits proliferation, migration, and induces apoptosis in PCa cells. (A) Chemical structure of thalicthuberine (TH). (B) Analysis of real-time proliferation, as a function of cell confluence (IncuCyte) of TH treated LNCaP cells. DMSO (vehicle) and vinblastine (Vinb) were used as controls (n = 3, mean ± SD, a representative experiment of 3 independent repeats is shown). Phase contrast images for DMSO, TH (2.5 µM), and Vinb (25 nM) treatments are shown for the indicated time points (top right panel), showing visibly less cells and signs of apoptotic cell death (membrane blebbing, rounded cell bodies) in TH and vinblastine treated cells. Scale bar = 100 µm. (C) Live assessment by microscopy and quantitative image analysis of Caspase-3/7 activity in TH- and vinblastine-treated LNCaP cells after 48 h of treatment. Both TH and vinblastine induced apoptosis in a concentration-dependent manner (left panels, n = 3, mean ± SD). Representative images of LNCaP cells. Right panel, merged image: DNA (blue), Caspase 3/7: CellEvent Caspase-3/7 substrate (pink), scale bar = 20 µm. (D) Evaluation of cell migration of TH-treated PC-3 cells. Wound closure was measured by live-cell imaging (IncuCyte) after 16 h of treatment with vehicle control (DMSO), TH, vinblastine (Vinb) or the positive control cytochalasin D (Cytoch) (left panel, n = 2, mean ± SD). Representative wounds after treatment with DMSO, TH and cytochalasin D are shown (right panel).
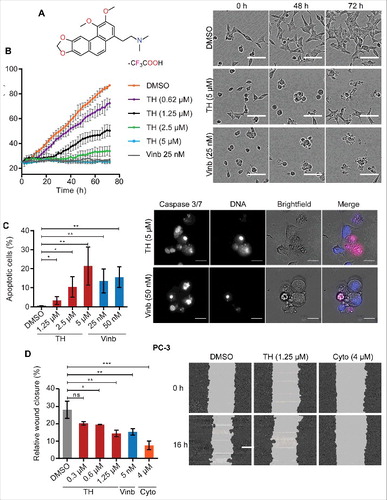
Table 1. Measurement of cytotoxic activity of TH against a panel of human malignant and non-malignant cell lines of the prostate and cervix.
Figure 2. Treatment of LNCaP cells with TH leads to deregulation of mitotic processes. (A) GeneOntology analysis of DNA microarray data (GOrilla) revealed “microtubule-based process,” “cell cycle process,” and “mitotic cell cycle process” as top enriched molecular pathways within the set of differentially expressed genes after 24 h of TH treatment (1 × IC50) in LNCaP cells. (B) Heatmap depicting the fold changes of genes differentially expressed (P value ≤ 0.1, fold-change of ≥ 1.4) in LNCaP cells after 24 h treatment with TH (1 × IC50) or vinblastine (Vinb, 1 × IC50). Red indicates upregulation. The darker the shade of color, the higher the fold-change of expression. (C) Validation of differential expression of critical cell cycle genes by qRT-PCR (n = 3, mean ± SD) in LNCaP cells treated for 24 h with TH (1 × IC50) or vinblastine (Vinb, 1 × IC50), confirming their upregulation.
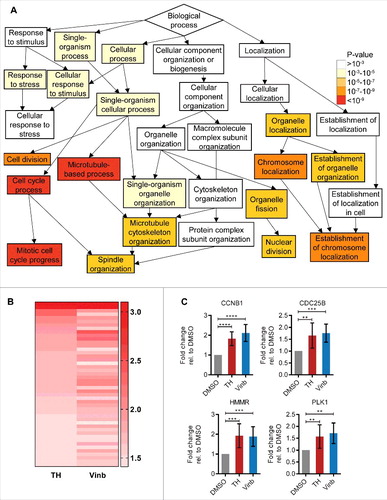
Figure 3. TH causes accumulation of cells in mitosis. (A) Cell cycle was analyzed by flow cytometry. TH arrests LNCaP cells in the G2-M phase in a concentration-dependent manner after 24 h (upper left panel). DMSO and vinblastine were used as controls (left panel, n = 4, mean ± SD, statistical data in Table S2). Representative histograms for DMSO and TH are shown (lower panel). TH treatment of LNCaP cells (24 h) leads to cell death (upper right panel, sub G0-G1 cell population, n = 3, mean ± SD). (B) Quantitative immunofluorescence microscopy of PHH3 expression (mitosis marker) revealed that TH and vinblastine caused a concentration-dependent increase of PHH3-positive LNCaP cells after 24 h (n = 3, mean ± SD). (C) Immunofluorescence microscopy coupled with automated image analysis (CellProfiler) was used to quantify PHH3-positive (mitotic) LNCaP cells (∼3,000 cells/treatment) after the indicated treatment conditions (n = 2, mean ± SD). TH (1.25–10 µM) and vinblastine (10 and 20 nM) induced a significant increase in PHH3-positive cells when treated for after 8 h (blue bars). Longer treatment (24 h, orange bars) further increased the proportion of PHH3-positive cells. Removal of TH (1.25 and 2.5 µM) and vinblastine (10 and 20 nM) after 8 h of treatment followed by 16 h of recovery decreased the number of PHH3-positive cells to levels seen in vehicle control (DMSO). Two-ways ANOVA with Sidak's multiple comparisons test was used (ns = non-significant, *** P < 0.001, **** P < 0.0001; blue label = statistical comparison to DMSO 8 h). (D) LNCaP cells were subjected to the same treatment modalities as described in C, and cell viability was measured after 72 h (alamarBlue, n = 2, mean ± SD). Intermittent treatment with TH (24 h) did not significantly reduced cell viability compared with continuous treatment (72 h). Two-ways ANOVA with Sidak's multiple comparisons test was used (ns = non-significant, ** P < 0.01, *** P < 0.001).
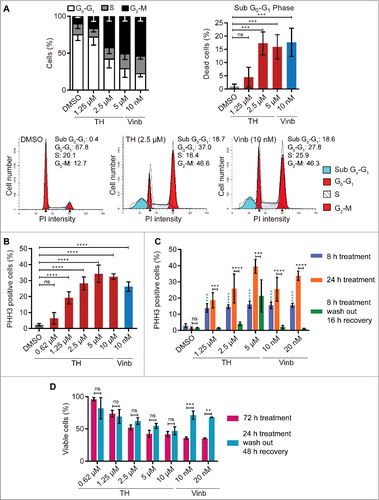
Figure 4. TH induced mitotic arrest is leading to asymmetric cell division and cell death. (A) Quantitative analysis of images acquired by time-lapse microscopy (Olympus IX81, 10 × , 1 image/5 min for 24 h) showed that TH and vinblastine significantly increased the time HeLa-H2B-GFP cells spent in mitosis (left panel). The cell fate (bipolar division, asymmetric division or apoptosis) was quantitatively assessed after 24 h of treatment (right panel, n = 2, mean ± SD). Representative images of cells treated with TH (2.5 µM) and DMSO. Black arrows indicate cells displaying signs of asymmetric division and fusion. Red arrows point at cells dying. Scale bar = 20 µm. (B) Tracking of cell fate of cells that underwent asymmetric division. Representative image of HeLa-H2B-GFP cells treated with TH (2.5 µM) and tracked for 106 h using real-time live-cell imaging (IncuCyte 10 × , 1 image/2 h for 144 h). White arrows indicate cells going through asymmetric division, fusion and dying in mitosis. Red arrows mark cells that die in an interphase-like state after 2 consecutive rounds of asymmetric division separated by a cell fusion event. Yellow arrows indicate cells going through asymmetric division, fusion and dying in an interphase-like state. Scale bar = 50 µm. For more details, see Videos 1–3.
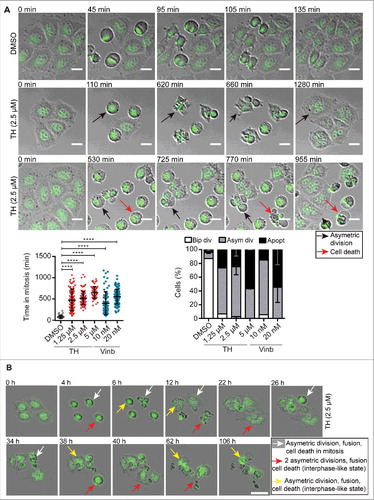
Figure 5. TH disrupts the mitotic spindle organization. (A) TH and vinblastine-treated LNCaP cells (24h) were subjected to immunofluorescence microscopy of α-tubulin (green) and PHH3 (red) with an INCell 2200 automated microscope (20 ×). Representative images (top panel) of abnormal metaphase aligments of chromosomes (PHH3 staining, red) and spindle pole organization (α-tubulin staining, green) are shown (scale bar = 10 µm). (B) Quantification by scoring phenotypic differences (bottom left panel, ∼400 cells/treatment) and measuring the distance between spindle poles (bottom right panel, ∼120 cells/treatment, yellow line) in bipolar cells are based on α-tubulin and PHH3 staining (n = 3, mean ± SD).
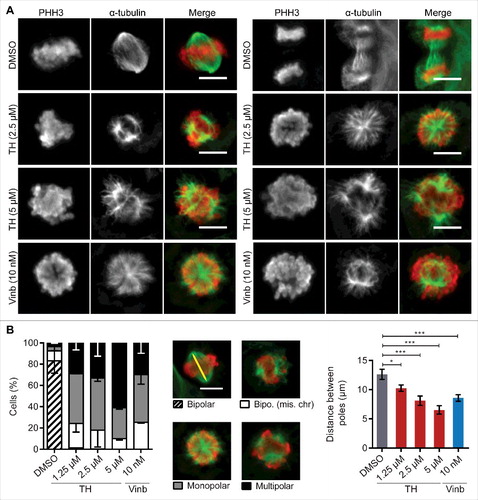
Figure 6. TH treatment leads to reduced cellular tubulin polymer mass and shortened MT tracks. (A) TH did not affect tubulin polymerization in a cell-free system, while vinblastine (Vinb) inhibited and paclitaxel (Paclit) stimulated polymerization. A representative experiment (n = 3) is shown. (B) High-dose treatment of LNCaP cells (24 h) with TH or vinblastine reduced cellular tubulin polymer mass, while paclitaxel increased tubulin polymer mass (top right panel), as shown by quantitative immunofluorescence microscopy of the mean intensity fold-change of α-tubulin relative to DMSO control (n = 3, mean ± SD). Representative images are shown (lower panel), illustrating disrupted cytoplasmic MT networks. Scale bar = 10 µm. (C) HeLa-EB1-GFP cells treated with TH or vinblastine (2 h) were imaged by spinning disk microscopy. EB1 comets were tracked and analyzed, and mean fold-change of displacement length of EB1 tracks was calculated relative to DMSO control. Like vinblastine, TH inhibited the growth of MTs in HeLa cells, as shown by reduced EB1 tracks in maximum intensity projections of EB1 comets (scale bar = 10 µm). For more details, see Videos 4−6.
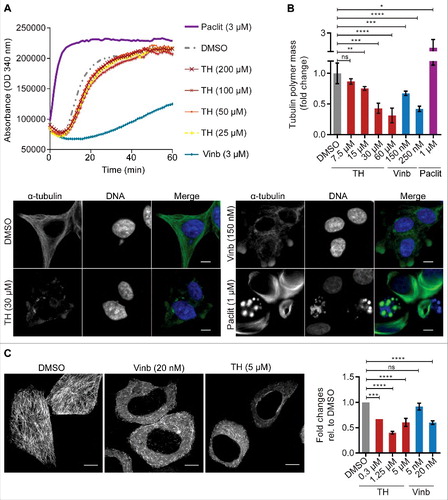
Figure 7. The mitotic inhibitors MNL8237 (Aurora kinase A inhibitor) and TH generate different phenotypes. (A) LNCaP cells treated with TH and the Aurora kinase A inhibitor MNL8237 for 24 h were subjected to immunofluorescence microscopy of Aurora A (green) and DNA (blue) with a DeltaVision Elite microscope (60 ×). As controls, cells were treated with the Plk1 inhibitor BI2536, vinblastine (Vinb, 10 nM), or vehicle control (DMSO). MNL8237 inhibited localization of Aurora A at the spindle poles, which was not affected by TH or BI2536. Representative images are shown. Scale bar = 10 µm. (B) Immunofluorescence microscopy coupled with automated image analysis was used to quantify PHH3-positive LNCaP cells after the indicated treatment conditions (left panel, n = 2, mean ± SD). Combination of TH and MNL8237 or vinblastine (Vinb) and MNL8237 generated the same phenotypes as MNL8237 treatment alone, including a loss of PHH3 expression. Representative images are shown (left panel), DNA (blue), α-tubulin (green), and PHH3 (pink). Mitotic cells are indicated by an arrow (strong nuclear condensed chromatin and a round cell morphology). Scale bar = 20 µm.
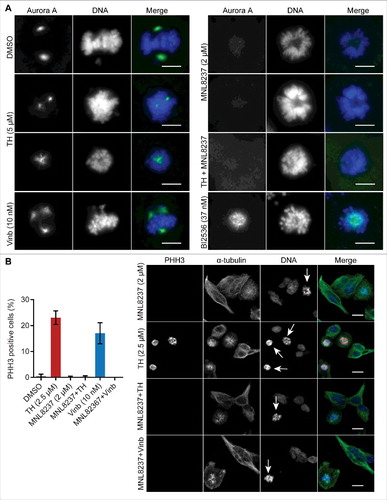
Figure 8. The Plk1 inhibitor BI2536 and TH generate different phenotypes. (A) LNCaP cells treated with 2 mitotic inhibitors, TH or BI2536 (Plk1 inhibitor), for 24 h were subjected to immunofluorescence microscopy of α-tubulin (green) and PHH3 (red) with a DeltaVision Elite microscope (60 ×, upper panel, scale bar = 10 µm) or an INCell 2200 (20 ×, lower panel, scale bar = 20 µm). As controls, cells were treated with vinblastine (Vinb, 10 nM) or vehicle control (DMSO). BI2536 inhibited spindle pole organization and predominantly generated cells with monopolar spindles and peripheral chromosome configurations, while TH generated heterogeneous spindle pole abnormalities (monopolar, bipolar and multipolar) with visibly congressed chromosomes. Cells treated with a combination of TH and BI2536 exhibited the BI2536-like phenotype. Representative images are shown, scale bar = 20 µm. (B) Quantification of time-lapse microscopy showed that TH and BI2536 increased the time HeLa-H2B-GFP cells spend in mitosis (left panel). The cell fate after 24 h (bipolar division, asymmetric division or cell death) was quantitatively assessed and showed that BI2536 alone or in combination with TH exclusively induced cell death, while TH as single treatment caused asymmetric divisions and cell death (right panel, ∼100 cells/treatment, n = 2, mean ± SD). One-way ANOVA with Turkey's multiple comparisons test was used (ns = non-significant, ** P < 0.01, **** P < 0.0001). See Video 3 for more details.
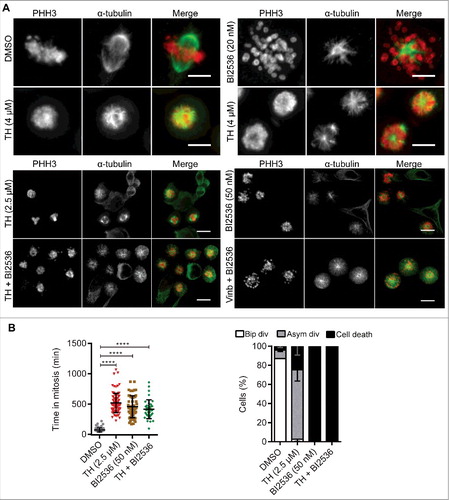
Table 2. Cytotoxicities of TH remains largely unaffected in cell lines with resistance to microtubule inhibitors and express multidrug resistance.
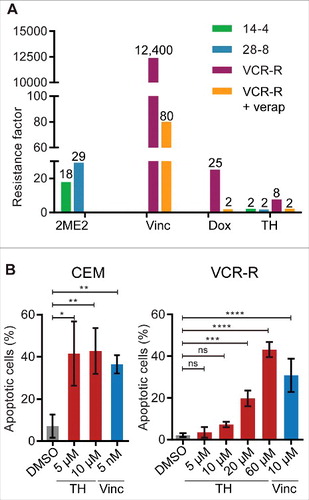
Figure 9. TH is insensitive to resistance mechanisms induced by MT inhibitors (vinca alkaloids and 2ME2). (A) Parental cells CEM (CEM), 2-methoxyestradiol (2ME2) resistant cell lines CEM/2ME2–14.4R (14–4) and CEM/2ME2–28.8R (28–8), and the vincristine (Vinc) resistant cell line CEM/VCR-R (VCR-R) were treated with 2ME2, Vinc, or TH for 72 h and cell viability was measured using a metabolic assay (alamarBlue, n = 3). Results were expressed as resistance factor (RF), which was calculated from the quotient of IC50 (drug-resistant cell line) and IC50 (parental CEM cells). TH activity remained largely unaffected in all 3 resistant cell lines when compared with CEM parental cells. The involvement of the P-glycoprotein (P-gp) in resistance observed in the CEM/VCR-R (VCR-R) cell line, was assessed by co-treatment with the P-gp inhibitor verapamil (verap). As control, cells were treated with the P-gp substrate doxorubicin (Dox). Co-treatment with verapamil almost completely re-sensitized CEM/VCR-R cells to TH and doxorubicin, suggesting that TH activity is not affected by mutation in the vinca alkaloid pocket on tubulin. (B) Live assessment by microscopy and quantitative image analysis of caspase-3/7 activity in TH- and vincristine-treated CEM and CEM/VCR-R (VCR-R) cells after 24 h of treatment (n = 3, mean ± SD). Similar doses of TH were necessary to induce apoptosis in both cell lines, while 2,000-fold higher dose of vincristine was required in VCR-R cells when compared with CEM cells.