Figures & data
Figure 1. Synchronization of INS 832/13 cells at different cell cycle stages. (A) INS 832/13 were serum starved (media supplemented with 0.1% fetal calf serum (FCS)) for 56 h, released into cell cycle (media suplemented with 10% FCS), 12 h later treated with aphidicolin for 12 h, then placed in media supplemented with 10% FCS without aphidicolin. Cells were collected at 0 h, 4 h and 12 h after aphidicolin release for flow cytometry analysis. (B) Representative flow cytometry analysis of DNA content in asynchronous and synchronized INS 832/13 at 0 h, 4 h and 12 h post aphidicolin treatment. (C) Representative cell cycle phase distribution of asynchronous and synchronized INS 832/13 collected at 0 h, 4 h and 12 h after aphidicolin release.
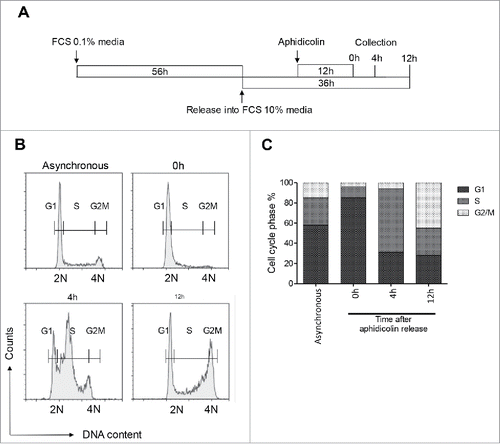
Figure 2. Cyclin protein expression in INS 832/13 cells during cell cycle. (A) Protein levels of cyclins were measured by western blot in INS 832/13 cells synchronized at G1/S (0 h post aphidicolin release), S (4 h post aphidicolin release), G2/M (12 h post aphidicolin release). Quantification of Cyclin A2 (B), Cyclin B1 (C) Cyclin E (D) protein levels. Data are presented as mean ± SEM, n = 6 (triplicate from two independent experiments), *p < 0.05, ** p < 0.01, ***p < 0.005.
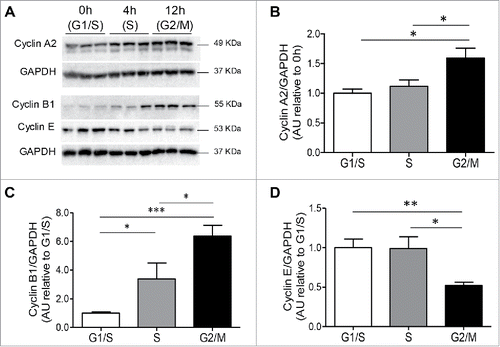
Figure 3. Clock genes transcript levels during cell cycle. (A) mRNA levels of the circadian clock genes, Per1 and Per2 (B), were measured by RT-PCR in INS 832/13 cells synchronized at G1/S (0 h post aphidicolin release), S (4 h post aphidicolin release) and G2/M (12 h post aphidicolin release). Data are presented as mean ± SEM. n = 6 (triplicate from two independent experiments), *p < 0.05, ** p < 0.01, ***p < 0.005.
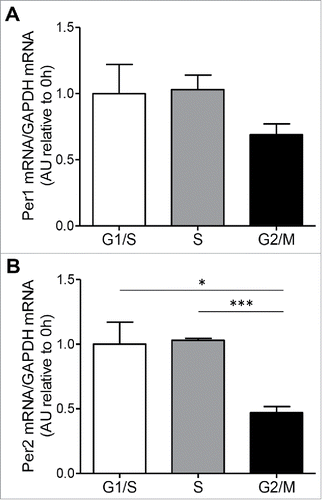
Figure 4. Changes in mitochondrial morphology at different phases of cell cycle in INS 832/13 cells. (A) 3D projection images of tubular, tubular-intermediate and fragmented mitochondria in synchronized INS 832/13 stained with Mitrotracker Red. Mitochondria were imaged using a confocal Zeiss microscope. (B) Quantification of mitochondrial network in INS 832/13 cells synchronized at G1/S, S and G2/M. Mitochondrial morphology was scored in 250 cells and the data are plotted as mean ± SEM from two independent experiments. (C) Protein levels of DRP1 phosphorylation at Serine 616 and total DRP1 were measured by western blot in INS 832/13 cells synchronized at G1/S, S, G2/M. (D) Quantification of pDRP1(616) and total DRP1 protein levels. Data are presented as mean ± SEM, n = 6 (triplicate from two independent experiments), *p < 0.05, ** p < 0.01, ***p < 0.005.
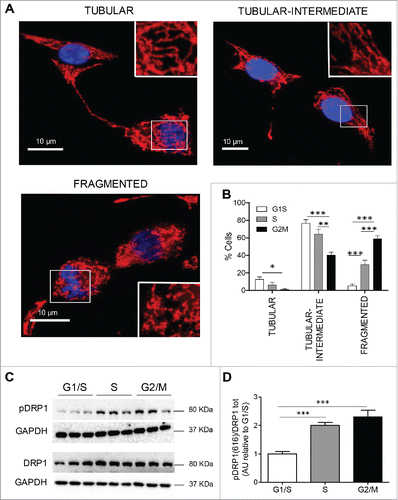
Figure 5. Oxygen consumption rate (OCR) and extracellular acidification rate (ECAR) are increased in INS 832/13 cells synchronized at S and G2/M phases. (A) Oxygen Consumption Rate (OCR) measurements were obtained over time (min) using an extracellular flux analyzer (Seahorse Bioscience). The mitochondrial stress test was used to obtain bioenergetics parameters, by adding the ATP synthase inhibitor Oligomycin A to derive ATP-linked OCR, FCCP to uncouple the mitochondria for maximal OCR, and Rotenone. Bioenergetic profile of INS 832/13 cells in different phases of cell cycle from one experiment (B) Basal oxygen consumption rate (OCR) (C), ATP-linked OCR and (D) ECAR in INS 832/13 cells synchronized at different phases of cell cycle (G1/S, S, G2/M) measured by Seahorse. Data are expressed as mean ± SEM, n = 20 (ten-plicate from two independent experiments), *p < 0.05, ***p < 0.005.
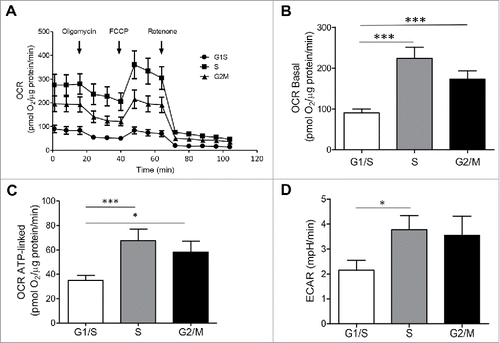
Figure 6. Changes in cytosolic and mitochondrial calcium at different phases of cell cycle in INS 832/13 cells. (A) endoplasmic reticulum (ER) (B) cytosolic and (C) mitochondrial calcium concentration was measured in INS 832/13 synchronized at G1/S, S and G2/M by cell imaging using D4ER FRET adenoviral probe, the calcium indicator Fura-2 and ratiometric Pericam respectively. Data are expressed as mean ± SEM, n = 20–30 (ten-plicate from two or three independent experiments), *p < 0.05, ** p < 0.01, ***p < 0.005.
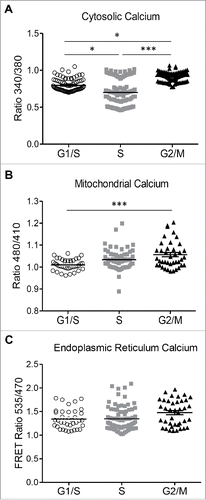
Figure 7. Changes of metabolic state of INS 832/13 beta-cells during cell cycle. (A) Glucose mass isotopomer distribution (MID) resulting from culture of synchronized INS 832/13 cells with [U-13C6] glucose for 24 h, (B), M2 fractions of a-ketoglutarate (a-KG), succinate (Suc), fumarate (Fum), malate (Mal), aspartate (Asp), (C), M3 fractions of a-ketoglutarate (a-KG), succinate (Suc), fumarate (Fum), malate (Mal), aspartate (Asp) succinate, (D), M4 fractions of a-ketoglutarate (a-KG), succinate (Suc), malate (Mal), aspartate (Asp), (E), Citrate mass isotopomer distribution (MID) resulting from culture of synchronized INS 832/13 cells with [U-13C6] glucose, (F) M5 fractions of purine nucleoside ADP and nucleotides ATP and GTP, (G), M5 fractions of pirimidine nucleoside CDP and UDP and nucleotides CTP and UTP, (H), Lactate mass isotopomer distribution (MID) resulting from culture synchronized INS 832/13 cells with [U-13C6] glucose. (I) Relative abundance of intracellular metabolites measured in INS 832/13 synchronized at different cell cycle stages (G1/S, S, G2/M) using GC/MS analysis. Data are expressed as mean ± SEM, n = 6 (triplicate from two independent experiments), *p < 0.05, **p < 0.01, ***p < 0.005.
![Figure 7. Changes of metabolic state of INS 832/13 beta-cells during cell cycle. (A) Glucose mass isotopomer distribution (MID) resulting from culture of synchronized INS 832/13 cells with [U-13C6] glucose for 24 h, (B), M2 fractions of a-ketoglutarate (a-KG), succinate (Suc), fumarate (Fum), malate (Mal), aspartate (Asp), (C), M3 fractions of a-ketoglutarate (a-KG), succinate (Suc), fumarate (Fum), malate (Mal), aspartate (Asp) succinate, (D), M4 fractions of a-ketoglutarate (a-KG), succinate (Suc), malate (Mal), aspartate (Asp), (E), Citrate mass isotopomer distribution (MID) resulting from culture of synchronized INS 832/13 cells with [U-13C6] glucose, (F) M5 fractions of purine nucleoside ADP and nucleotides ATP and GTP, (G), M5 fractions of pirimidine nucleoside CDP and UDP and nucleotides CTP and UTP, (H), Lactate mass isotopomer distribution (MID) resulting from culture synchronized INS 832/13 cells with [U-13C6] glucose. (I) Relative abundance of intracellular metabolites measured in INS 832/13 synchronized at different cell cycle stages (G1/S, S, G2/M) using GC/MS analysis. Data are expressed as mean ± SEM, n = 6 (triplicate from two independent experiments), *p < 0.05, **p < 0.01, ***p < 0.005.](/cms/asset/089a8433-66ce-4c72-ad2a-817c0a0406f7/kccy_a_1361069_f0007_b.gif)
Table 1. Changes of metabolic parameters during the cell cycle.
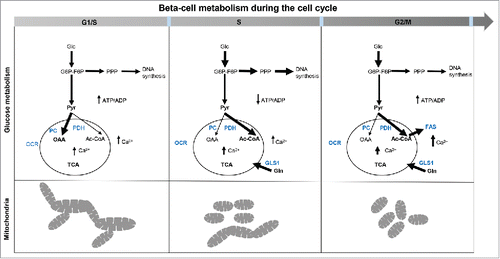
Figure 8. Cellular metabolism in replicating INS 832/13. Schematic of the metabolic changes in INS 832/13 cells synchronized at G1/S, S and G2/M. At G1/S fused-to-intermediate mitochondria dominate and coincide with a peak in the pyruvate anaplerosis; this is alternated in the S phase by a higher involvement of pyruvate dehydrogenase branch of the TCA cycle and more prominent diversion of glucose into the pentose phosphate pathway while at G2/M more fatty acids are synthesized important for securing membrane formation in mitosis and there is another rise in Ca2+ necessary for mitosis. Mitochondria are more fragmented in the S phase and at G2/M phase of the cell cycle to secure mitochondrial inheritance during division.
