1,326
Views
8
CrossRef citations to date
0
Altmetric
Reports

Protease dead separase inhibits chromosome segregation and RAB-11 vesicle trafficking

& ORCID Icon
Pages 1902-1917 | Received 10 May 2017, Accepted 30 Jul 2017, Published online: 08 Sep 2017

Figures & data

Figure 1. SEP-1PD::GFP causes chromosome segregation defects during mitosis. Representative images of mitotic chromosome segregation in SEP-1WT::GFP expressing embryos (A-D, green) or homozygous SEP-1PD::GFP (green) embryos with slight bridging (E-H) and severe bridging (I-L) co-expressing H2B::mCherry (red). (M) Average distance between separating sister chromatids (as shown by arrowheads in B, F, J) during anaphase in SEP-1WT::GFP (n = 7) or SEP-1PD::GFP (n = 9) embryos from metaphase to late cytokinesis. (N) Percentage of embryos displaying normal chromosome separation (blue), slight bridging chromosomes (red) or severe chromosome bridges (green) during the first mitosis in embryos expressing either SEP-1WT::GFP or SEP-1PD::GFP at the temperature indicated (n = number of embryos imaged). Insert shows H2B::mCherry images scored as normal, slight bridging and severe bridging. Scale Bars, 10 μm. P-values: * = <0.05; **** = <0.0001 (t-test). Error bars indicated standard deviation of the mean.
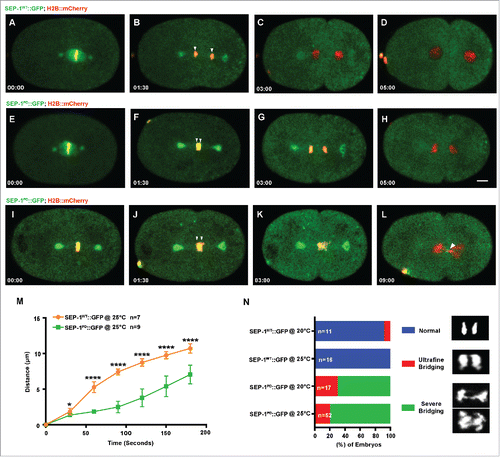
Figure 1. SEP-1PD::GFP causes chromosome segregation defects during mitosis. Representative images of mitotic chromosome segregation in SEP-1WT::GFP expressing embryos (A-D, green) or homozygous SEP-1PD::GFP (green) embryos with slight bridging (E-H) and severe bridging (I-L) co-expressing H2B::mCherry (red). (M) Average distance between separating sister chromatids (as shown by arrowheads in B, F, J) during anaphase in SEP-1WT::GFP (n = 7) or SEP-1PD::GFP (n = 9) embryos from metaphase to late cytokinesis. (N) Percentage of embryos displaying normal chromosome separation (blue), slight bridging chromosomes (red) or severe chromosome bridges (green) during the first mitosis in embryos expressing either SEP-1WT::GFP or SEP-1PD::GFP at the temperature indicated (n = number of embryos imaged). Insert shows H2B::mCherry images scored as normal, slight bridging and severe bridging. Scale Bars, 10 μm. P-values: * = <0.05; **** = <0.0001 (t-test). Error bars indicated standard deviation of the mean.

Figure 2. SEP-1PD::GFP causes chromosome segregation defects during meiosis I. Representative images of meiotic chromosome segregation in SEP-1WT::GFP (A-D, green) or homozygous SEP-1PD::GFP expressing embryos (E-H, green) co-expressing H2B::mCherry (red). Lower left insets show H2B::mCherry. (I) Average distance between chromosomes (indicated by arrowheads in B, F) during anaphase in SEP-1WT::GFP or homozygous SEP-1PD::GFP. (J) Percentage of embryos displaying normal chromosome separation (blue), bridging chromosomes (red) during the anaphase I in embryos expressing either SEP-1WT::GFP or homozygous SEP-1PD::GFP (n = number of embryos imaged). Insets show examples scored as normal or bridging chromosomes during anaphase I. Scale Bars, 10 μm. P-values: * = <0.05; ns = not significant (t-test). Error bars indicated standard deviation of the mean.
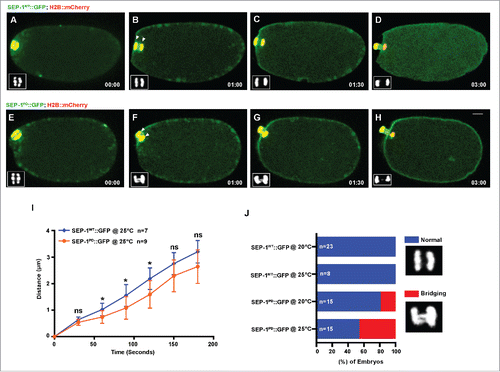
Figure 2. SEP-1PD::GFP causes chromosome segregation defects during meiosis I. Representative images of meiotic chromosome segregation in SEP-1WT::GFP (A-D, green) or homozygous SEP-1PD::GFP expressing embryos (E-H, green) co-expressing H2B::mCherry (red). Lower left insets show H2B::mCherry. (I) Average distance between chromosomes (indicated by arrowheads in B, F) during anaphase in SEP-1WT::GFP or homozygous SEP-1PD::GFP. (J) Percentage of embryos displaying normal chromosome separation (blue), bridging chromosomes (red) during the anaphase I in embryos expressing either SEP-1WT::GFP or homozygous SEP-1PD::GFP (n = number of embryos imaged). Insets show examples scored as normal or bridging chromosomes during anaphase I. Scale Bars, 10 μm. P-values: * = <0.05; ns = not significant (t-test). Error bars indicated standard deviation of the mean.

Figure 3. Cohesin depletion rescues chromosome segregation defects caused by SEP-1PD::GFP. (A, B) Partial cohesin depletion significantly rescues the SEP-1PD::GFP embryonic lethality at both 20°C and 25°C (n = singled worm number: total embryo count). (C-F) Chromosome segregation defects were significantly alleviated after partial depletion of scc-1 in homozygous SEP-1PD::GFP (green) embryos (DNA in red). (G) Distance between separating sister chromatids during anaphase in SEP-1WT::GFP or SEP-1PD::GFP control or with scc-1 (RNAi). (H) Percentage of embryos displaying normal chromosome separation (blue), slight bridging chromosomes (red) or severe chromosome bridges (green) during the first mitosis in embryos expressing SEP-1WT::GFP or SEP-1PD::GFP with and without scc-1 (RNAi) treatment (n = number of embryos imaged). Scale Bars, 10 μm. P-values: ** = <0.01; *** = <0.001; **** = <0.0001 (t-test). Error bars indicated standard deviation of the mean.
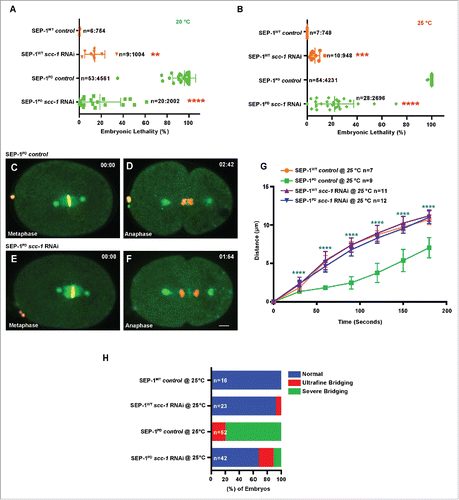
Figure 3. Cohesin depletion rescues chromosome segregation defects caused by SEP-1PD::GFP. (A, B) Partial cohesin depletion significantly rescues the SEP-1PD::GFP embryonic lethality at both 20°C and 25°C (n = singled worm number: total embryo count). (C-F) Chromosome segregation defects were significantly alleviated after partial depletion of scc-1 in homozygous SEP-1PD::GFP (green) embryos (DNA in red). (G) Distance between separating sister chromatids during anaphase in SEP-1WT::GFP or SEP-1PD::GFP control or with scc-1 (RNAi). (H) Percentage of embryos displaying normal chromosome separation (blue), slight bridging chromosomes (red) or severe chromosome bridges (green) during the first mitosis in embryos expressing SEP-1WT::GFP or SEP-1PD::GFP with and without scc-1 (RNAi) treatment (n = number of embryos imaged). Scale Bars, 10 μm. P-values: ** = <0.01; *** = <0.001; **** = <0.0001 (t-test). Error bars indicated standard deviation of the mean.

Figure 4. SEP-1PD::GFP causes cytokinesis defects. (A) Percentage of embryos displaying normal cell division (blue) and cytokinesis failure (red) during first mitotic division in N2 wild type, SEP-1WT::GFP or homozygous SEP-1PD::GFP. Right panels show examples scored as normal or cytokinesis failure. (B) Quantification of the furrow ingression rate in different genotypes. Depletion of SCC-1 in SEP-1PD::GFP embryos does not rescue the slower furrow ingression (p = 0.29 (t-test), n = number of embryos imaged). (C) Quantification of the furrow ingression time in different conditions as indicated (n = number of embryos imaged). (D) Kymograph of the furrow region shows PH::mCherry (red) in SEP-1WT::GFP, homozygous SEP-1PD::GFP, SEP-1PD::GFP; scc-1(RNAi) (time in seconds indicated below), or AIR-2::GFP (green) expressing PH::mCherry (red) and H2B::mCherry (red) with and without top-2 (RNAi) during cytokinesis. Distance between separating sister chromatids at similar times after anaphase onset is indicated by brackets, furrow SEP-1PD::GFP signal is indicated by arrowheads. Cohesin depletion rescues chromosome segregation, but not furrowing. The lower kymograph of an embryo treated with top-2 (RNAi) has chromatin in the path of the furrow without any change in furrow ingression. Scale Bars, 10 μm. Error bars indicated standard deviation of the mean. Each kymograph image is 6 seconds apart. P-values: *** = <0.001; **** = <0.0001 (t-test).
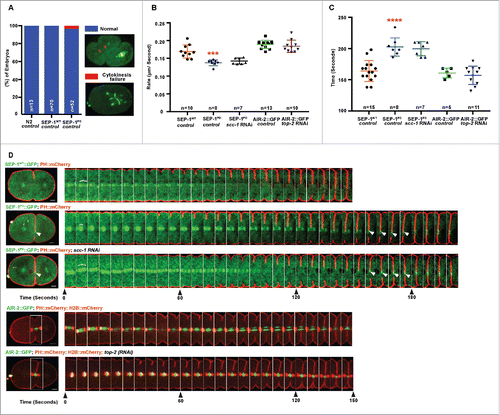
Figure 4. SEP-1PD::GFP causes cytokinesis defects. (A) Percentage of embryos displaying normal cell division (blue) and cytokinesis failure (red) during first mitotic division in N2 wild type, SEP-1WT::GFP or homozygous SEP-1PD::GFP. Right panels show examples scored as normal or cytokinesis failure. (B) Quantification of the furrow ingression rate in different genotypes. Depletion of SCC-1 in SEP-1PD::GFP embryos does not rescue the slower furrow ingression (p = 0.29 (t-test), n = number of embryos imaged). (C) Quantification of the furrow ingression time in different conditions as indicated (n = number of embryos imaged). (D) Kymograph of the furrow region shows PH::mCherry (red) in SEP-1WT::GFP, homozygous SEP-1PD::GFP, SEP-1PD::GFP; scc-1(RNAi) (time in seconds indicated below), or AIR-2::GFP (green) expressing PH::mCherry (red) and H2B::mCherry (red) with and without top-2 (RNAi) during cytokinesis. Distance between separating sister chromatids at similar times after anaphase onset is indicated by brackets, furrow SEP-1PD::GFP signal is indicated by arrowheads. Cohesin depletion rescues chromosome segregation, but not furrowing. The lower kymograph of an embryo treated with top-2 (RNAi) has chromatin in the path of the furrow without any change in furrow ingression. Scale Bars, 10 μm. Error bars indicated standard deviation of the mean. Each kymograph image is 6 seconds apart. P-values: *** = <0.001; **** = <0.0001 (t-test).

Figure 5. SEP-1PD::GFP was enhanced by t-SNARE syx-4 depletion. (A) Representative images of mitotic cytokinesis in SEP-1WT::GFP (A, green) or homozygous SEP-1PD::GFP (B, green) embryos co-expressing PH::mCherry (red). (B) Representative images of mitotic cytokinesis failure in homozygous SEP-1PD::GFP; PH::mCherry expressing embryos with syx-4 (RNAi), resulting in a one cell embryo with a multi-polar spindle. (C) Percentage of embryos displaying normal cytokinesis (blue) or cytokinesis failure (red) in different conditions as indicated (n = number of embryos imaged). Scale Bars, 10 μm.
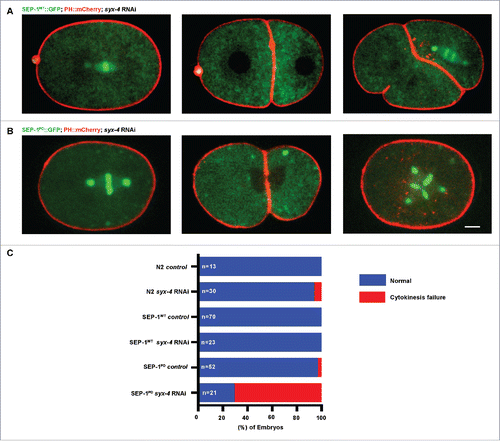
Figure 5. SEP-1PD::GFP was enhanced by t-SNARE syx-4 depletion. (A) Representative images of mitotic cytokinesis in SEP-1WT::GFP (A, green) or homozygous SEP-1PD::GFP (B, green) embryos co-expressing PH::mCherry (red). (B) Representative images of mitotic cytokinesis failure in homozygous SEP-1PD::GFP; PH::mCherry expressing embryos with syx-4 (RNAi), resulting in a one cell embryo with a multi-polar spindle. (C) Percentage of embryos displaying normal cytokinesis (blue) or cytokinesis failure (red) in different conditions as indicated (n = number of embryos imaged). Scale Bars, 10 μm.

Figure 6. SEP-1PD::GFP inhibits RAB-11 positive vesicle trafficking during cytokinesis. (A, B) Representative images and kymograph of RAB-11::mCherry (red) trafficking to the furrow in SEP-1WT::GFP (green) or heterozygous SEP-1PD::GFP/+ (green). Arrowheads denote enhanced RAB-11::mCherry (gray) accumulation. (C, D) syx-4 (RNAi) enhances RAB-11::mCherry (gray) in both SEP-1WT::GFP and SEP-1PD::GFP/+ at the furrow and midbody. (E) Kymograph of the furrow region showing that RAB-6::mCherry (red) and SEP-1WT::GFP (green) do not accumulate in the furrow. (F) Accumulation of heterozygous SEP-1PD::GFP/+ (green) is observed at the furrow and midbody, but not RAB-6::mCherry (red). (G) Quantification of separase and RAB-11 signals in the midbody during cytokinesis in different conditions as indicated. (H) The percentage of embryos displaying cytokinesis failure in heterozygous SEP-1PD::GFP/+ (green) embryos expressing RAB-11::mCherry/+ (red) with indicated conditions. Scale Bars, 10 μm. P-values: * = <0.05; ** = <0.01; **** = <0.0001 (t-test). Error bars indicated standard error of the mean. Each kymograph image is 6 seconds apart.
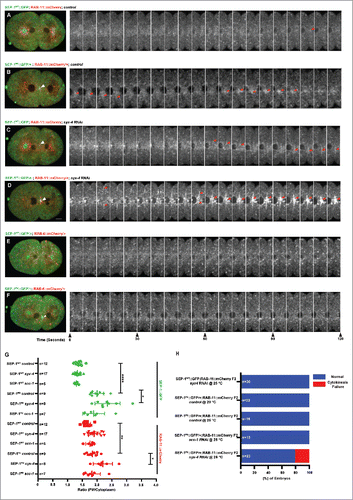
Figure 6. SEP-1PD::GFP inhibits RAB-11 positive vesicle trafficking during cytokinesis. (A, B) Representative images and kymograph of RAB-11::mCherry (red) trafficking to the furrow in SEP-1WT::GFP (green) or heterozygous SEP-1PD::GFP/+ (green). Arrowheads denote enhanced RAB-11::mCherry (gray) accumulation. (C, D) syx-4 (RNAi) enhances RAB-11::mCherry (gray) in both SEP-1WT::GFP and SEP-1PD::GFP/+ at the furrow and midbody. (E) Kymograph of the furrow region showing that RAB-6::mCherry (red) and SEP-1WT::GFP (green) do not accumulate in the furrow. (F) Accumulation of heterozygous SEP-1PD::GFP/+ (green) is observed at the furrow and midbody, but not RAB-6::mCherry (red). (G) Quantification of separase and RAB-11 signals in the midbody during cytokinesis in different conditions as indicated. (H) The percentage of embryos displaying cytokinesis failure in heterozygous SEP-1PD::GFP/+ (green) embryos expressing RAB-11::mCherry/+ (red) with indicated conditions. Scale Bars, 10 μm. P-values: * = <0.05; ** = <0.01; **** = <0.0001 (t-test). Error bars indicated standard error of the mean. Each kymograph image is 6 seconds apart.

Figure 7. SEP-1PD::GFP expression delays cortical granule exocytosis. (A-F) Representative images of separase localization during anaphase I. Localization of SEP-1WT::GFP (A, green) and SEP-1PD::GFP (D, green) to cortical granules indicated by white arrowheads (H2B::mCherry in red). CGE was delayed in homozygous SEP-1PD::GFP (E) compared with SEP-1WT::GFP (B) during late anaphase I. (F) SEP-1PD::GFP associated with the cortex for a longer time after CGE compared with SEP-1WT::GFP (C). (G) Quantification of anaphase onset to completion of CGE. SEP-1PD::GFP embryos take longer to finish CGE than SEP-1WT::GFP. (H-J) Colocalization of SEP-1PD::GFP (green) with PH::Cherry (red) at the plasma membrane after CGE. (K) Average time that SEP-1WT::GFP or SEP-1PD::GFP remains associated with the plasma membrane after CGE. (L) Ratio of plasma membrane to cytoplasmic SEP-1PD::GFP and SEP-1WT::GFP after onset of anaphase I. Scale Bars, 10 μm. P-values: * = <0.05; *** = <0.001; **** = <0.0001; ns = not significant (t-test). Error bars indicated standard error of the mean.
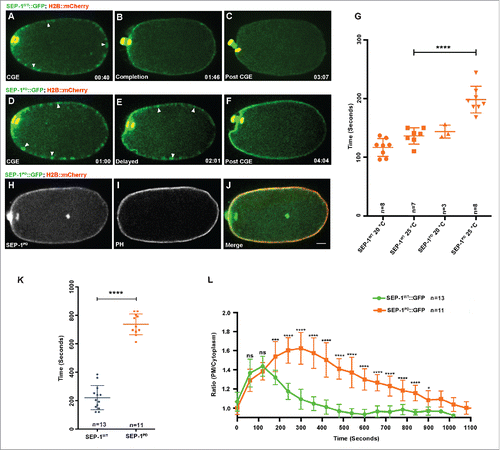
Figure 7. SEP-1PD::GFP expression delays cortical granule exocytosis. (A-F) Representative images of separase localization during anaphase I. Localization of SEP-1WT::GFP (A, green) and SEP-1PD::GFP (D, green) to cortical granules indicated by white arrowheads (H2B::mCherry in red). CGE was delayed in homozygous SEP-1PD::GFP (E) compared with SEP-1WT::GFP (B) during late anaphase I. (F) SEP-1PD::GFP associated with the cortex for a longer time after CGE compared with SEP-1WT::GFP (C). (G) Quantification of anaphase onset to completion of CGE. SEP-1PD::GFP embryos take longer to finish CGE than SEP-1WT::GFP. (H-J) Colocalization of SEP-1PD::GFP (green) with PH::Cherry (red) at the plasma membrane after CGE. (K) Average time that SEP-1WT::GFP or SEP-1PD::GFP remains associated with the plasma membrane after CGE. (L) Ratio of plasma membrane to cytoplasmic SEP-1PD::GFP and SEP-1WT::GFP after onset of anaphase I. Scale Bars, 10 μm. P-values: * = <0.05; *** = <0.001; **** = <0.0001; ns = not significant (t-test). Error bars indicated standard error of the mean.

Figure 8. SEP-1PD::GFP does not affect RAB-11 after cortical granule exocytosis. Representative images of meiosis I in embryos expressing separase (green) and RAB-11 (red). (A, D) RAB-11 localizes to cortical granules several minutes before anaphase, before either SEP-1WT::GFP (B, green) or SEP-1PD::GFP/+ (E, green) localize to cortical granules. SEP-1WT::GFP (B, green) and SEP-1PD::GFP (E, green) colocalize with RAB-11::mCherry (red) on the cortical granules in anaphase I. White arrowheads denote colocalization of separase and RAB-11 on cortical granules. (C, F) After exocytosis, SEP-1PD::GFP/+ associated with the plasma membrane while SEP-1WT::GFP and RAB-11::mCherry rapidly disappeared. (G-I) Surface plane of SEP-1WT::GFP (G) and RAB-11::mCherry (H) clearly shows their colocalization (merge in I) on cortical granules. (J) Working model of separase function in exocytosis during cytokinesis. Separase cleaves cohesin kleisin subunit SCC-1 during mitotic anaphase and promotes chromosome segregation. In cytokinesis, separase colocalizes with RAB-11 vesicles. SNAREs including SYX-4 promote vesicle fusion with target membrane. Our results suggest that separase cleaves an unknown substrate to promote exocytosis. Scale Bars, 10 μm.
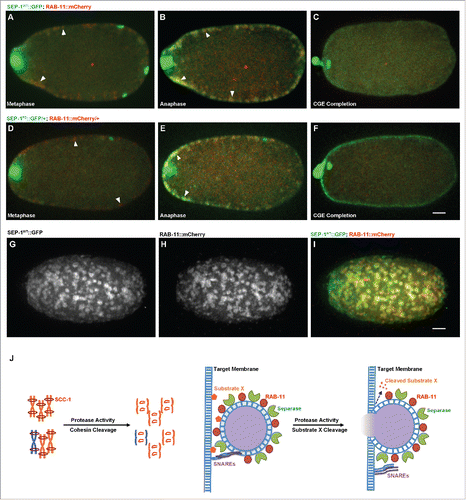
Figure 8. SEP-1PD::GFP does not affect RAB-11 after cortical granule exocytosis. Representative images of meiosis I in embryos expressing separase (green) and RAB-11 (red). (A, D) RAB-11 localizes to cortical granules several minutes before anaphase, before either SEP-1WT::GFP (B, green) or SEP-1PD::GFP/+ (E, green) localize to cortical granules. SEP-1WT::GFP (B, green) and SEP-1PD::GFP (E, green) colocalize with RAB-11::mCherry (red) on the cortical granules in anaphase I. White arrowheads denote colocalization of separase and RAB-11 on cortical granules. (C, F) After exocytosis, SEP-1PD::GFP/+ associated with the plasma membrane while SEP-1WT::GFP and RAB-11::mCherry rapidly disappeared. (G-I) Surface plane of SEP-1WT::GFP (G) and RAB-11::mCherry (H) clearly shows their colocalization (merge in I) on cortical granules. (J) Working model of separase function in exocytosis during cytokinesis. Separase cleaves cohesin kleisin subunit SCC-1 during mitotic anaphase and promotes chromosome segregation. In cytokinesis, separase colocalizes with RAB-11 vesicles. SNAREs including SYX-4 promote vesicle fusion with target membrane. Our results suggest that separase cleaves an unknown substrate to promote exocytosis. Scale Bars, 10 μm.

Table 1. Strains used in this study.

Supplemental material

KCCY_S_1363936_Supplementary_material.zip

Download Zip (53.3 MB)

Reprints and Corporate Permissions

Please note: Selecting permissions does not provide access to the full text of the article, please see our help page How do I view content?

To request a reprint or corporate permissions for this article, please click on the relevant link below:

Academic Permissions

Please note: Selecting permissions does not provide access to the full text of the article, please see our help page How do I view content?

Obtain permissions instantly via Rightslink by clicking on the button below:

If you are unable to obtain permissions via Rightslink, please complete and submit this Permissions form. For more information, please visit our Permissions help page.