Figures & data
Figure 1. Effect of LPS treatment on cell morphology. Upper panels (A, B, and C) show phase-contrast microscopy analysis of treated and untreated neuronal differentiated NE-4C cells. Differentiation was achieved by treating NE-4C cells with 100 nM RA for 48h in all conditions (NE-4C-RA). Micrographs illustrate unstimulated cells (A) acute LPS-stimulated NE-4C-RA cells (B) and chronic LPS-stimulated NE-4C-RA cells (C). Middle (D, E, and F) and lower panels (G, H, and I) show the immunolocalization of the neuronal marker NF-H (Heavy Neurofilament) and the astrocyte marker GFAP (Glial Fibrillary Acidic Protein) respectively, in treated (E, F, H, and I) and untreated NE-4C-RA cells (D and G). Micrographs show unstimulated (D and G), acute LPS-stimulated (E and H) and chronic LPS-stimulated (F and I). LPS treatment significantly decreases neurite number and length NE-4C-RA cells. Data presented are representative of 3 independent experiments; (Bar 100µm).
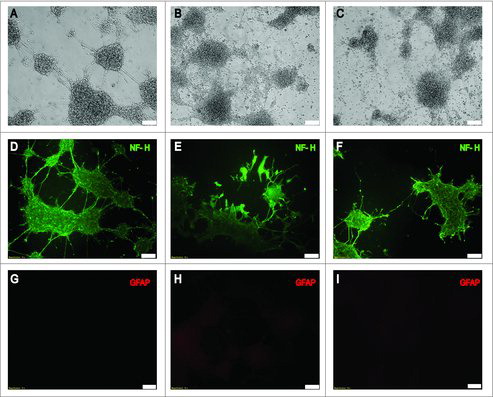
Figure 2. Effect of LPS on Cell Cycle. Cell cycle analysis by flow cytometry of proliferating NE-4C cells (A), RA-differentiated NE-4C cells, NE-4C-RA, (B), acute LPS-stimulated NE-4C-RA cells (C) and chronic LPS stimulated NE-4C-RA cells (D). Exposure to RA caused cell cycle withdrawal of neuronal cells, indicated by G0/G1 arrest (A vs. B). LPS treatment induced accumulation of NE-4C-RA cells in S and G2/M phase (C and D vs. B). The accumulation of NE-4C-RA cells in S and G2/M phase was particularly pronounced under LPS chronic stimulation. Data presented are representative of 3 independent experiments run in triplicate.
Figure 3. Effect of LPS treatment on cell death. The figure shows apoptosis analysis in unstimulated neuronal differentiated NE-4C-RA cells (CTR), acute LPS-stimulated NE-4C-RA cells (LPS-A) and chronic LPS stimulated NE-4C-RA cells (LPS-C). Apoptosis was assessed using a standard flow cytometry-based Annexin V/PI apoptosis assay. As shown in , LPS treatment induced apoptotic cell death in both acute (LPS-A) and chronic condition (LPS-C). In , the ratio of apoptosis among different experimental groups was reported. Apoptosis ratio was early apoptosis percentage plus late apoptosis percentage. The data were presented as the means ± SEM. Columns, mean of three independent experiments; SEM; ****p ≤ 0.0001.
Figure 4. Effect of LPS treatment of RB family protein expression. Western Blotting analysis was performed to assess the effect of acute LPS treatment (LPS-A) and chronic LPS treatment (LPS-C) on the expression of RBL2/p130, RBL1/p107, RB1/p105 in neuronal differentiated NE-4C-RA. As shown in and , both acute and chronic LPS treatment induced a significant increase in RBL1/p107 expression as compared to untreated NE-4C-RA cells (CTR). Only chronic LPS treatment was able to induce a significant increase in RB1/p105 expression. No significant effect was observed in RBL2/p130 expression after LPS treatment. The expression of GAPDH was assessed to normalize protein loading. The data were presented as the means ± SEM. Columns, mean of three independent experiments; bars, SEM; ***p ≤ 0.0005; ****p ≤ 0.0001.