1,096
Views
15
CrossRef citations to date
0
Altmetric
Reports

The pro-apoptotic BAX protein influences cell growth and differentiation from the nucleus in healthy interphasic cells

ORCID Icon, ORCID Icon, , , , , , , , & show all
Pages 2108-2118 | Received 26 Apr 2017, Accepted 19 Aug 2017, Published online: 21 Sep 2017

Figures & data

Figure 1. Nuclear form of BAX is associated with chromatin in interphasic in A549 cells and primary HLF. (A) Immunoblot after subcellular fractionation in lung derived cell types (A549 cells and primary HLF) showing BAX presence in cytoplasm (cyto) with GAPDH protein and in the nuclear fraction (nuc) with general transcription factor YY1. (B) Representative immunoblot showing the differential extraction of BAX in DSP crosslinked A549 cells and primary HLF. Immunoblot showing that BAX, Histone H2B (chromatin marker) and GAPDH (cytoplasmic marker) in the corresponding pellets (pel.) and supernatants (sup.) after sequential extraction with 1) Triton CSK buffer, 2) 0.5 M NaCl high salt buffer and finally digestion of chromatin bulks with micrococcal nuclease (MNase). The right panels (no MNase and MNase treated conditions) were exposed longer than the ones on the left (CSK and 0.5 M NaCl treated samples) Note the absence of BAX and H2B in the supernatant of the control condition with no micrococcal nuclease (no MNase).
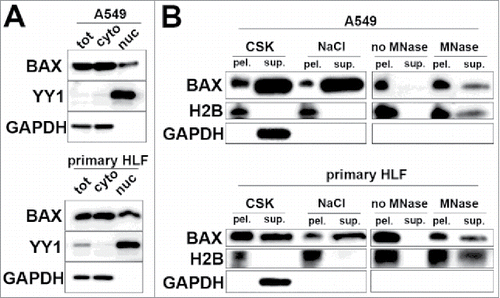
Figure 1. Nuclear form of BAX is associated with chromatin in interphasic in A549 cells and primary HLF. (A) Immunoblot after subcellular fractionation in lung derived cell types (A549 cells and primary HLF) showing BAX presence in cytoplasm (cyto) with GAPDH protein and in the nuclear fraction (nuc) with general transcription factor YY1. (B) Representative immunoblot showing the differential extraction of BAX in DSP crosslinked A549 cells and primary HLF. Immunoblot showing that BAX, Histone H2B (chromatin marker) and GAPDH (cytoplasmic marker) in the corresponding pellets (pel.) and supernatants (sup.) after sequential extraction with 1) Triton CSK buffer, 2) 0.5 M NaCl high salt buffer and finally digestion of chromatin bulks with micrococcal nuclease (MNase). The right panels (no MNase and MNase treated conditions) were exposed longer than the ones on the left (CSK and 0.5 M NaCl treated samples) Note the absence of BAX and H2B in the supernatant of the control condition with no micrococcal nuclease (no MNase).

Figure 2. Effects of BAX knock down on A549 and primary HLF proliferation in vitro. (A) A549 cells or (B) primary HLF were treated with the transfection reagent alone (lipofectamine, Lipo.) or transfected with a non-targeting siRNA (Cont. siRNA) or two different BAX siRNA sequences for 48h. Immunoblot was revealed with an anti-BAX antibody and GAPDH as loading control. Phase contrast pictures of cells transfected with control lipofectamine alone (Lipo, left panel), control siRNA (Cont. siRNA, middle panel) and BAX siRNA #1 (right panel) suggest a decreased in proliferation in BAX siRNA #1 treated cells. Similar results were observed with BAX siRNA #2 (data not shown). (C) Effects of BAX siRNA #1 and #2 on the proliferation (cell count) of A549 cells (left panel, respectively 40.9%+/− 4.3 and 19%+/− 1.9 growth decrease for BAX siRNA #1 and #2, n = 7) and primary HLF (right panel, respectively 26%+/− 5 and 24.6%+/− 2.4 growth decrease for BAX siRNA #1 and #2, n = 7) compared to cells treated with control siRNA (gray dash line) at 48h (*p < 0.05,Wilcoxon rank t-Test). (D) Representative immunoblot confirming the absence of BAX protein in three independent BAX/ A549 clones compared to control / wild type (WT) A549 cells. Immunoblot was revealed with an anti-BAX antibody and GAPDH as loading control. Effect of complete BAX loss of function on the proliferation of A549 cells (33.3%+/− 5.5 growth decrease for BAX −/− cells compared to control cells (n = 6), *p < 0.05, Wilcoxon rank t-Test). (E) Clonogenic assay performed with A549 cells transfected with control siRNA or with the two different BAX siRNA (respectively 44%+/− 5 and 32%+/− 3.2 decrease for BAX siRNA #1 and #2, n = 3). Pictures of Crystal violet stained colony assay of A549 cells after 5 days of serum starvation and 7 days of recovery in complete medium are showed on the upper part (500 cells were initially plated). Quantification of images from three independent experiments after Crystal violet staining is showed on the lower part. Note the growth inhibition in BAX siRNA A549 cells compared to controls. (*p < 0.05, rank t-Test, n = 3).
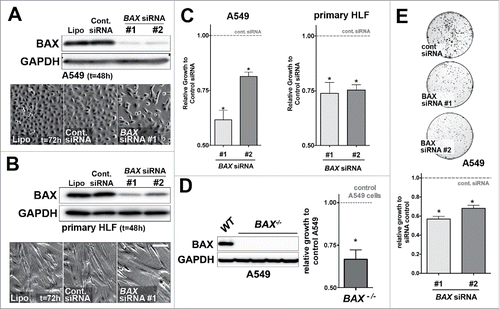
Figure 2. Effects of BAX knock down on A549 and primary HLF proliferation in vitro. (A) A549 cells or (B) primary HLF were treated with the transfection reagent alone (lipofectamine, Lipo.) or transfected with a non-targeting siRNA (Cont. siRNA) or two different BAX siRNA sequences for 48h. Immunoblot was revealed with an anti-BAX antibody and GAPDH as loading control. Phase contrast pictures of cells transfected with control lipofectamine alone (Lipo, left panel), control siRNA (Cont. siRNA, middle panel) and BAX siRNA #1 (right panel) suggest a decreased in proliferation in BAX siRNA #1 treated cells. Similar results were observed with BAX siRNA #2 (data not shown). (C) Effects of BAX siRNA #1 and #2 on the proliferation (cell count) of A549 cells (left panel, respectively 40.9%+/− 4.3 and 19%+/− 1.9 growth decrease for BAX siRNA #1 and #2, n = 7) and primary HLF (right panel, respectively 26%+/− 5 and 24.6%+/− 2.4 growth decrease for BAX siRNA #1 and #2, n = 7) compared to cells treated with control siRNA (gray dash line) at 48h (*p < 0.05,Wilcoxon rank t-Test). (D) Representative immunoblot confirming the absence of BAX protein in three independent BAX−/− A549 clones compared to control / wild type (WT) A549 cells. Immunoblot was revealed with an anti-BAX antibody and GAPDH as loading control. Effect of complete BAX loss of function on the proliferation of A549 cells (33.3%+/− 5.5 growth decrease for BAX −/− cells compared to control cells (n = 6), *p < 0.05, Wilcoxon rank t-Test). (E) Clonogenic assay performed with A549 cells transfected with control siRNA or with the two different BAX siRNA (respectively 44%+/− 5 and 32%+/− 3.2 decrease for BAX siRNA #1 and #2, n = 3). Pictures of Crystal violet stained colony assay of A549 cells after 5 days of serum starvation and 7 days of recovery in complete medium are showed on the upper part (500 cells were initially plated). Quantification of images from three independent experiments after Crystal violet staining is showed on the lower part. Note the growth inhibition in BAX siRNA A549 cells compared to controls. (*p < 0.05, rank t-Test, n = 3).

Figure 3. Upregulation of the cell cycle inhibitor CDKN1A upon BAX knock down in A549 and primary HLF. (A) Expression of CDKN1A mRNA by qPCR in A549 cells transfected for 48h with two different BAX siRNA compared to siRNA control (gray dash line, n = 6 experiments; left part) or in BAX-/ A549 cells compared to wild type A549 cells (gray dash line, n = 5; right part). In the left inside, representative immunoblot (n = 5) of BAX, CDKN1A protein level in A549 cells (treated with lipofectamine alone (Lipo), control siRNA (Cont siRNA) and two different BAX siRNA (#1 and #2). In the right inside, representative immunoblot confirming the absence of BAX protein and the upregulation of CDKN1A protein level in three independent BAX/ A549 clones compared to control / wild type (WT) A549 cells. GAPDH was used as loading control. (*p < 0.05, Wilcoxon rank t-Test). (B) Expression of CDKN1A mRNA by qPCR in primary HLF transfected for 48h with two different BAX siRNA compared to siRNA control (gray dash line, n = 6 experiments). Representative immunoblot (n = 5) of BAX, CDKN1Aprotein level (lower part) in primary HLF treated with lipofectamine alone (Lipo), control siRNA (Cont siRNA) and two different BAX siRNA (#1 and #2). GAPDH was used as loading control. (*p < 0.05, Wilcoxon rank t-Test). (C) Schematic diagram of the CDKN1A locus showing PCR amplified fragments. A region encompassing CDKN1A transcription starting sites (TSS) was amplified. The −2.3 kb and −1.6 kb sites are two P53 upstream response elements at CDKN1A promoters. The −3.8 kb upstream non-specific site was used as a negative control site. ChIP analysis for recruitment of BAX at the CDKN1A promoter in A549 cells (n = 3) and primary lung fibroblasts (n = 4) was performed as described in materials and methods. For each condition, an unrelated control IgG was used as negative control. Note that BAX binding was specifically enriched at the vicinity of CDKN1A TSS in both cell types. (*p < 0.05, paired t-Test).
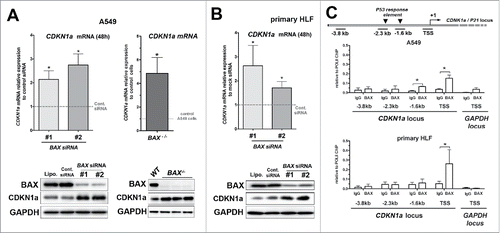
Figure 3. Upregulation of the cell cycle inhibitor CDKN1A upon BAX knock down in A549 and primary HLF. (A) Expression of CDKN1A mRNA by qPCR in A549 cells transfected for 48h with two different BAX siRNA compared to siRNA control (gray dash line, n = 6 experiments; left part) or in BAX-/− A549 cells compared to wild type A549 cells (gray dash line, n = 5; right part). In the left inside, representative immunoblot (n = 5) of BAX, CDKN1A protein level in A549 cells (treated with lipofectamine alone (Lipo), control siRNA (Cont siRNA) and two different BAX siRNA (#1 and #2). In the right inside, representative immunoblot confirming the absence of BAX protein and the upregulation of CDKN1A protein level in three independent BAX−/− A549 clones compared to control / wild type (WT) A549 cells. GAPDH was used as loading control. (*p < 0.05, Wilcoxon rank t-Test). (B) Expression of CDKN1A mRNA by qPCR in primary HLF transfected for 48h with two different BAX siRNA compared to siRNA control (gray dash line, n = 6 experiments). Representative immunoblot (n = 5) of BAX, CDKN1Aprotein level (lower part) in primary HLF treated with lipofectamine alone (Lipo), control siRNA (Cont siRNA) and two different BAX siRNA (#1 and #2). GAPDH was used as loading control. (*p < 0.05, Wilcoxon rank t-Test). (C) Schematic diagram of the CDKN1A locus showing PCR amplified fragments. A region encompassing CDKN1A transcription starting sites (TSS) was amplified. The −2.3 kb and −1.6 kb sites are two P53 upstream response elements at CDKN1A promoters. The −3.8 kb upstream non-specific site was used as a negative control site. ChIP analysis for recruitment of BAX at the CDKN1A promoter in A549 cells (n = 3) and primary lung fibroblasts (n = 4) was performed as described in materials and methods. For each condition, an unrelated control IgG was used as negative control. Note that BAX binding was specifically enriched at the vicinity of CDKN1A TSS in both cell types. (*p < 0.05, paired t-Test).

Figure 4.  

Figure 4. Gain of function experiments with BAX proteins targeted either to the nucleus (NLS-BAX) or excluded from the nucleus (NES-BAX) in A549 cells and primary HLF. (A) Representative immunoblot (n = 3) after subcellular fractionation in primary HLF transfected for 48h with an empty pCDNA 3.1 vector, NES-BAX or NLS-BAX constructs. The upper panel with anti-FLAG (upper panel) and BAX (middle panel) antibodies show that the NES-BAX or NLS-BAX constructs are detected in the cytosolic fraction (cyto.), revealed with GAPDH antibody. In the nuclear fraction (nuc.), revealed with LMN A/C, only NLS-BAX was detected (arrowhead). Note that NES-BAX and NLS-BAX are detected at a higher molecular weight than endogenous BAX (*). (B-C) Effects of NES and NLS-BAX on the proliferation (cell count) of A549 cells (B) and primary HLF (C) compared to cells treated with control plasmid (gray dashed line) at 48h. Note that the increase in cell proliferation was observed only in NLS-BAX transfected A549 cells (41% increase +/− 8, n = 4) and primary HLF (102% increase +/− 67, n = 5) compared to pCDNA 3.1 empty vector and NES-BAX construct (respectively 9% increase +/− 9 compared to control plasmid in A549 cells, n = 4 and 15% decrease +/− 10 in primary HLF, n = 3) compared to control plasmid. (D-E) Expression of CDKN1A mRNA by qPCR (upper part) in (D) A549 cells and (E) primary HLF transfected for 48h with NES-BAX (respectively 19.4% decrease +/− 4 in A549 cells and 27.6% increase +/− 29 in primary HLF, n = 5) or NLS-BAX (respectively 41.6% decrease +/− 7 in A549 cells and 51.54% decrease +/− 16 in primary HLF, n = 5) compared to empty vector (gray dash line). Representative immunoblot (n = 3) of FLAG tagged BAX constructs, CDKN1A, in A549 cells (D) or primary HLF (E) transfected with empty control vector, either NES-BAX or NLS-BAX constructs for 48h. GAPDH was used as loading control. (*p < 0.05, rank t-Test).
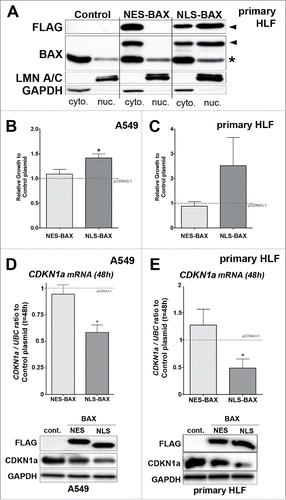
Figure 4.  Figure 4. Gain of function experiments with BAX proteins targeted either to the nucleus (NLS-BAX) or excluded from the nucleus (NES-BAX) in A549 cells and primary HLF. (A) Representative immunoblot (n = 3) after subcellular fractionation in primary HLF transfected for 48h with an empty pCDNA 3.1 vector, NES-BAX or NLS-BAX constructs. The upper panel with anti-FLAG (upper panel) and BAX (middle panel) antibodies show that the NES-BAX or NLS-BAX constructs are detected in the cytosolic fraction (cyto.), revealed with GAPDH antibody. In the nuclear fraction (nuc.), revealed with LMN A/C, only NLS-BAX was detected (arrowhead). Note that NES-BAX and NLS-BAX are detected at a higher molecular weight than endogenous BAX (*). (B-C) Effects of NES and NLS-BAX on the proliferation (cell count) of A549 cells (B) and primary HLF (C) compared to cells treated with control plasmid (gray dashed line) at 48h. Note that the increase in cell proliferation was observed only in NLS-BAX transfected A549 cells (41% increase +/− 8, n = 4) and primary HLF (102% increase +/− 67, n = 5) compared to pCDNA 3.1 empty vector and NES-BAX construct (respectively 9% increase +/− 9 compared to control plasmid in A549 cells, n = 4 and 15% decrease +/− 10 in primary HLF, n = 3) compared to control plasmid. (D-E) Expression of CDKN1A mRNA by qPCR (upper part) in (D) A549 cells and (E) primary HLF transfected for 48h with NES-BAX (respectively 19.4% decrease +/− 4 in A549 cells and 27.6% increase +/− 29 in primary HLF, n = 5) or NLS-BAX (respectively 41.6% decrease +/− 7 in A549 cells and 51.54% decrease +/− 16 in primary HLF, n = 5) compared to empty vector (gray dash line). Representative immunoblot (n = 3) of FLAG tagged BAX constructs, CDKN1A, in A549 cells (D) or primary HLF (E) transfected with empty control vector, either NES-BAX or NLS-BAX constructs for 48h. GAPDH was used as loading control. (*p < 0.05, rank t-Test).

Figure 5. Effect of BAX knock down or NES-, NLS-BAX gains of function on the basal myofibroblastic differentiation state and migration of primary HLF in vitro. (A) Expression of αSMA (left part), COL1A2 (right part) mRNA by qPCR in primary HLF transfected for 48 h with two different BAX siRNA. Note the increase expression of αSMA in primary HLF treated with BAX siRNA (96.6% increase +/− 40 and 52.5% increase +/− 38 respectively with BAX siRNA #1 and #2) compared to siRNA control (gray dash line, n = 5). In contrast, BAX siRNA did not modulate COL1A2 mRNA expression in primary HLF (respectively 5.6% increase +/− 21 in and 5.1% increase +/− 23 with BAX siRNA #1 and #2) compared to siRNA control (gray dash line, n = 5). In the right part, representative immunoblot (n = 5) of BAX, αSMA, COL1 protein levels in primary cells treated with lipofectamine alone (Lipo.), control siRNA (Cont siRNA) and two different BAX siRNA pooled to increase efficiency. GAPDH was used as loading control. Note the increase expression of αSMA and COL1 protein in BAX siRNA treated HLF. (B) Expression of αSMA (left part), COL1A2 (right part) mRNA by qPCR in primary HLF transfected for 48h with either NES-BAX (respectively 14.4% increase +/− 35 for αSMA mRNA and 57.5% increase +/− 33 for COL1A2 mRNA) or NLS-BAX (respectively 47% decrease +/− 18 for αSMA mRNA and 55% decrease +/− 15 for COL1A2 mRNA, n = 3) compared to empty control vector (gray dash line). In the right part: representative immunoblot (n = 3) of FLAG tagged overexpressed BAX constructs, αSMA and COL1 proteins in primary HLF transfected with empty control vector, either NES-BAX or NLS-BAX constructs for 48h. GAPDH was used as loading control. A decrease in αSMA protein level was observed only in NLS-BAX transfected cells, Collagen-1 isoform levels were decreased with both NES- and NLS-BAX constructs. Note that the COL1 and αSMA blots in panel (B) were exposed longer than the ones in panel (A) (*p < 0.05, rank t-Test). (C) Migratory capacities of primary lung fibroblasts in modified Boyden chamber assay after transfection with two different BAX siRNA (compared to control siRNA gray dash line, upper part) or after transfection with either NES-BAX (2.8 ± 0.8-fold increase; p < 0.05; n = 5) or NLS-BAX (13.06 ± 7.1-fold increase; p < 0.05; n = 5) compared to empty control vector (gray dash line, lower part). Data are median with outer box edges to min and max and whiskers to SEM. (*p < 0.05,Wilcoxon rank t-Test)
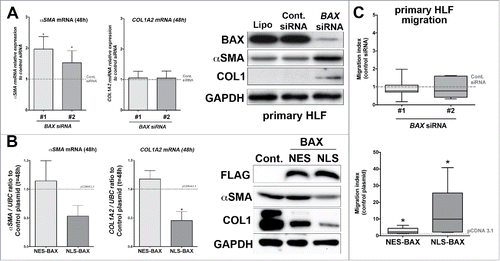
Figure 5. Effect of BAX knock down or NES-, NLS-BAX gains of function on the basal myofibroblastic differentiation state and migration of primary HLF in vitro. (A) Expression of αSMA (left part), COL1A2 (right part) mRNA by qPCR in primary HLF transfected for 48 h with two different BAX siRNA. Note the increase expression of αSMA in primary HLF treated with BAX siRNA (96.6% increase +/− 40 and 52.5% increase +/− 38 respectively with BAX siRNA #1 and #2) compared to siRNA control (gray dash line, n = 5). In contrast, BAX siRNA did not modulate COL1A2 mRNA expression in primary HLF (respectively 5.6% increase +/− 21 in and 5.1% increase +/− 23 with BAX siRNA #1 and #2) compared to siRNA control (gray dash line, n = 5). In the right part, representative immunoblot (n = 5) of BAX, αSMA, COL1 protein levels in primary cells treated with lipofectamine alone (Lipo.), control siRNA (Cont siRNA) and two different BAX siRNA pooled to increase efficiency. GAPDH was used as loading control. Note the increase expression of αSMA and COL1 protein in BAX siRNA treated HLF. (B) Expression of αSMA (left part), COL1A2 (right part) mRNA by qPCR in primary HLF transfected for 48h with either NES-BAX (respectively 14.4% increase +/− 35 for αSMA mRNA and 57.5% increase +/− 33 for COL1A2 mRNA) or NLS-BAX (respectively 47% decrease +/− 18 for αSMA mRNA and 55% decrease +/− 15 for COL1A2 mRNA, n = 3) compared to empty control vector (gray dash line). In the right part: representative immunoblot (n = 3) of FLAG tagged overexpressed BAX constructs, αSMA and COL1 proteins in primary HLF transfected with empty control vector, either NES-BAX or NLS-BAX constructs for 48h. GAPDH was used as loading control. A decrease in αSMA protein level was observed only in NLS-BAX transfected cells, Collagen-1 isoform levels were decreased with both NES- and NLS-BAX constructs. Note that the COL1 and αSMA blots in panel (B) were exposed longer than the ones in panel (A) (*p < 0.05, rank t-Test). (C) Migratory capacities of primary lung fibroblasts in modified Boyden chamber assay after transfection with two different BAX siRNA (compared to control siRNA gray dash line, upper part) or after transfection with either NES-BAX (2.8 ± 0.8-fold increase; p < 0.05; n = 5) or NLS-BAX (13.06 ± 7.1-fold increase; p < 0.05; n = 5) compared to empty control vector (gray dash line, lower part). Data are median with outer box edges to min and max and whiskers to SEM. (*p < 0.05,Wilcoxon rank t-Test)

Figure 6. BAX localization in fetal and adult lung tissues by immunohistochemistry. (A and B) Immunohistochemistry showing BAX staining (red chromogen) in human fetal lung at 12 weeks of gestation. Note that BAX was nuclear in epithelium (ep) and in the mesenchyme (mes). Higher magnification is showed in (B) showing BAX nuclear staining in epithelial cells (black arrow). (C) BAX localization in normal alveolar (upper panel) and bronchiolar (arrow in lower panel) epithelia. The insert in the upper panel shows BAX staining in the normal alveolar epithelium (arrow). (D and E) BAX staining in (D) the epithelium of lung non-small cell lung carcinoma (NSCLC) such as adenocarcinoma (arrow); and (E) within the tumor stroma (arrows). (F and G) BAX staining in (F) the epithelium of small cell lung carcinoma (arrow, SCLC n = 8) and (G) within the tumor stroma (arrow). Note that the fibroblasts within the stroma of these tumors also displayed BAX nuclear staining (see arrows in E and G). (H-J) BAX staining in idiopathic pulmonary fibrosis (IPF), the insert in (H) shows BAX staining in the hyperplastic epithelium (hyp AE2C, arrow). (I) BAX staining within fibroblastic foci (Fibro foci) underneath remodeled distal epithelium (ep) in IPF lung. Note the nuclear BAX staining in the fibroblasts (arrow) within fibroblast foci (J) BAX staining within bronchiolised distal airspace (bronch ep) in IPF lung. (K) Negative staining with control IgG. Nuclei are counterstained with hematoxylin. BAX nuclear localization was also confirmed using another anti-BAX primary antibody in control and IPF lung tissues by immunohistochemistry (data not shown). Scale bar: 20 µm (B, G, E, I, J, and lower panel in C), 10 µm (inserts in B, C, D, F, G, and H), 100 µm (A), 80 µm (C, D, F, K, and H).
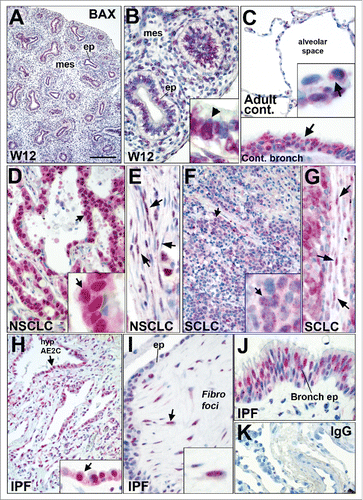
Figure 6. BAX localization in fetal and adult lung tissues by immunohistochemistry. (A and B) Immunohistochemistry showing BAX staining (red chromogen) in human fetal lung at 12 weeks of gestation. Note that BAX was nuclear in epithelium (ep) and in the mesenchyme (mes). Higher magnification is showed in (B) showing BAX nuclear staining in epithelial cells (black arrow). (C) BAX localization in normal alveolar (upper panel) and bronchiolar (arrow in lower panel) epithelia. The insert in the upper panel shows BAX staining in the normal alveolar epithelium (arrow). (D and E) BAX staining in (D) the epithelium of lung non-small cell lung carcinoma (NSCLC) such as adenocarcinoma (arrow); and (E) within the tumor stroma (arrows). (F and G) BAX staining in (F) the epithelium of small cell lung carcinoma (arrow, SCLC n = 8) and (G) within the tumor stroma (arrow). Note that the fibroblasts within the stroma of these tumors also displayed BAX nuclear staining (see arrows in E and G). (H-J) BAX staining in idiopathic pulmonary fibrosis (IPF), the insert in (H) shows BAX staining in the hyperplastic epithelium (hyp AE2C, arrow). (I) BAX staining within fibroblastic foci (Fibro foci) underneath remodeled distal epithelium (ep) in IPF lung. Note the nuclear BAX staining in the fibroblasts (arrow) within fibroblast foci (J) BAX staining within bronchiolised distal airspace (bronch ep) in IPF lung. (K) Negative staining with control IgG. Nuclei are counterstained with hematoxylin. BAX nuclear localization was also confirmed using another anti-BAX primary antibody in control and IPF lung tissues by immunohistochemistry (data not shown). Scale bar: 20 µm (B, G, E, I, J, and lower panel in C), 10 µm (inserts in B, C, D, F, G, and H), 100 µm (A), 80 µm (C, D, F, K, and H).
Supplemental material

1371882_Supplemental_Material.zip

Download Zip (391.4 KB)

Reprints and Corporate Permissions

Please note: Selecting permissions does not provide access to the full text of the article, please see our help page How do I view content?

To request a reprint or corporate permissions for this article, please click on the relevant link below:

Academic Permissions

Please note: Selecting permissions does not provide access to the full text of the article, please see our help page How do I view content?

Obtain permissions instantly via Rightslink by clicking on the button below:

If you are unable to obtain permissions via Rightslink, please complete and submit this Permissions form. For more information, please visit our Permissions help page.