865
Views
2
CrossRef citations to date
0
Altmetric
Reports

Differentiation of lepidoptera scale cells from epidermal stem cells followed by ecdysone-regulated DNA duplication and scale secreting

, , , , ORCID Icon &
Pages 2156-2167 | Received 23 Jun 2017, Accepted 01 Sep 2017, Published online: 21 Sep 2017

Figures & data

Figure 1. Morphological changes in the silkworm during metamorphosis. (A) Morphologies of the silkworm at different developmental stages. (a) Silkworm larvae on day 5 of the 5th larval stage (V-5). After that, the larvae enter the wandering (W) stage (b) and begin to spin. At the end of spinning (W-33 h), the larvae become short and enter the pre-pupa stage (c). Morphologies of pupae (day 2 of pupae; P-2) and adults (day 1 of adults; A-1) are also shown. (B) Apoptosis detection from the beginning of wandering (W-0 h) to the P-4 stages. The 7th and 8th segments were sampled for the assay. (a, b) W-33 h; (c-f) P-2; (g-h) P-4. In (a, c, e, g), pictures were merged from those using the blue filter (DAPI) and the red filter (TUNEL). In (b, d, f, h), pictures were merged from those using the DIC filter and the filters described previously. In (a-d, g, h), the 7th segments (SE) and in (e, f) the intersegmental membrane (IM) were assayed. (C) A Summary of apoptosis in the integument from larvae to adults. Apoptosis signals were detected from P-1 to P-4 and the bar thickness indicates the relative amount of apoptotic cells detected. No apoptotic cells were detected in other stages. Bar: (A) 5 mm; (B) 35 μm.
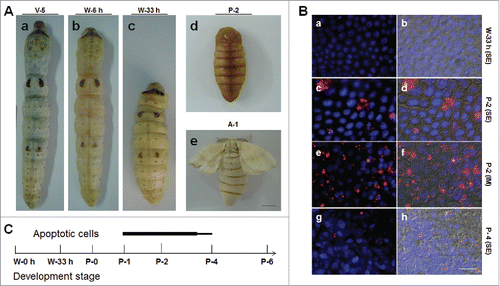
Figure 1. Morphological changes in the silkworm during metamorphosis. (A) Morphologies of the silkworm at different developmental stages. (a) Silkworm larvae on day 5 of the 5th larval stage (V-5). After that, the larvae enter the wandering (W) stage (b) and begin to spin. At the end of spinning (W-33 h), the larvae become short and enter the pre-pupa stage (c). Morphologies of pupae (day 2 of pupae; P-2) and adults (day 1 of adults; A-1) are also shown. (B) Apoptosis detection from the beginning of wandering (W-0 h) to the P-4 stages. The 7th and 8th segments were sampled for the assay. (a, b) W-33 h; (c-f) P-2; (g-h) P-4. In (a, c, e, g), pictures were merged from those using the blue filter (DAPI) and the red filter (TUNEL). In (b, d, f, h), pictures were merged from those using the DIC filter and the filters described previously. In (a-d, g, h), the 7th segments (SE) and in (e, f) the intersegmental membrane (IM) were assayed. (C) A Summary of apoptosis in the integument from larvae to adults. Apoptosis signals were detected from P-1 to P-4 and the bar thickness indicates the relative amount of apoptotic cells detected. No apoptotic cells were detected in other stages. Bar: (A) 5 mm; (B) 35 μm.

Figure 2. Cell division in the silkworm integument. (A) The morphology of the 7th segment (labeled as (1)) and the intersegmental membrane (labeled as (2)) between the 7th and 8th segments. (B) One wave of cell division was detected in the 7th segment after W-0 h. The arrows point to PH3-positive cells that were undergoing cell division in the 7th segment (1) but not in the intersegmental membrane (2). (C, D) Detection of DNA duplication after a pulse of BrdU with BrdU incorporation stained as green. In (C), the arrow points to BrdU-positive cells appearing in pairs. In (D), the arrow points to larger nuclei that incorporated BrdU, and the arrowheads point to small nuclei without BrdU incorporated. (E) Another wave of cell division was detected at P-1:18 h (after P-0:12 h) as indicated by PH3 staining. (F) Injection of BrdU every 6 h after P-0:0 h until the sampling time as indicated. At P-1:18 h, BrdU-positive cells appear in pairs, and some BrdU-positive cells in pairs became larger than others. (G) After a pulse of BrdU injection at P-2, BrdU was incorporated by cells with small scales produced. The BrdU-positive cells were observed as singles and not in pairs. (H) After labeling by BrdU as shown in (F), at P-3:5 h, the larger BrdU-positive cells were observed to have small scales produced. (I) A summary of the two waves of cell division in the integument. (J) The integument stem cells divide into precursor scale cells after symmetrical cell division during the wandering stage. Upon entering the pupal stage, the precursor scale cells differentiate into scale secreting cells after an asymmetrical cell division. The red bar indicates a scale. The nucleus is drawn in blue. Bar: (B-D) 35 μm; (E-H) 15 μm.
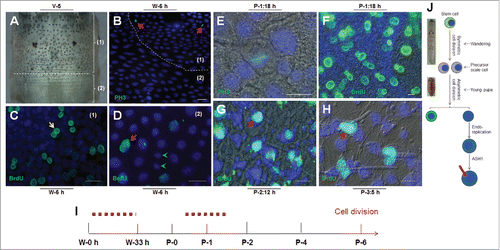
Figure 2. Cell division in the silkworm integument. (A) The morphology of the 7th segment (labeled as (1)) and the intersegmental membrane (labeled as (2)) between the 7th and 8th segments. (B) One wave of cell division was detected in the 7th segment after W-0 h. The arrows point to PH3-positive cells that were undergoing cell division in the 7th segment (1) but not in the intersegmental membrane (2). (C, D) Detection of DNA duplication after a pulse of BrdU with BrdU incorporation stained as green. In (C), the arrow points to BrdU-positive cells appearing in pairs. In (D), the arrow points to larger nuclei that incorporated BrdU, and the arrowheads point to small nuclei without BrdU incorporated. (E) Another wave of cell division was detected at P-1:18 h (after P-0:12 h) as indicated by PH3 staining. (F) Injection of BrdU every 6 h after P-0:0 h until the sampling time as indicated. At P-1:18 h, BrdU-positive cells appear in pairs, and some BrdU-positive cells in pairs became larger than others. (G) After a pulse of BrdU injection at P-2, BrdU was incorporated by cells with small scales produced. The BrdU-positive cells were observed as singles and not in pairs. (H) After labeling by BrdU as shown in (F), at P-3:5 h, the larger BrdU-positive cells were observed to have small scales produced. (I) A summary of the two waves of cell division in the integument. (J) The integument stem cells divide into precursor scale cells after symmetrical cell division during the wandering stage. Upon entering the pupal stage, the precursor scale cells differentiate into scale secreting cells after an asymmetrical cell division. The red bar indicates a scale. The nucleus is drawn in blue. Bar: (B-D) 35 μm; (E-H) 15 μm.

Figure 3. Integument cell division during early pupal stage is important to scale development. (A) Injection of paclitaxel, a cell division inhibitor, affects the formation of scales. Paclitaxel (2 μg) was injected at P-0:20 h. No scale was observed on the dorsal side. (B, C) Detection of cell division after paclitaxel injection in pupae on P-2. DMSO did not inhibit cell division as indicated by PH3 staining (B). No cell division was detected if paclitaxel was injected (C). (D, E) 72 h after paclitaxel treatment, BrdU was injected. (D) DMSO did not affect DNA duplication and scale formation. (E) Paclitaxel injection did not inhibit DNA duplication, but few scales were detected. (F) A summary of the importance of the second wave of cell division to scale formation. The red bar indicates a scale. The nucleus is drawn in blue. Bar: (A) 5 mm; (B-E) 20 μm.
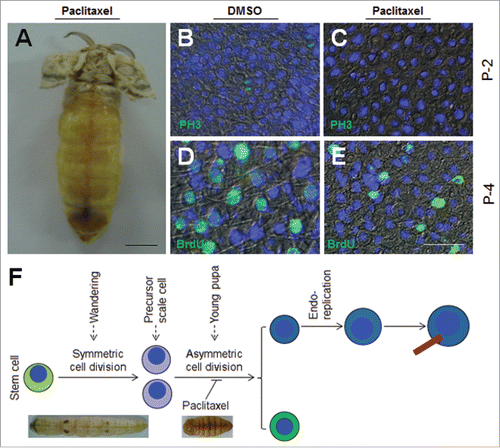
Figure 3. Integument cell division during early pupal stage is important to scale development. (A) Injection of paclitaxel, a cell division inhibitor, affects the formation of scales. Paclitaxel (2 μg) was injected at P-0:20 h. No scale was observed on the dorsal side. (B, C) Detection of cell division after paclitaxel injection in pupae on P-2. DMSO did not inhibit cell division as indicated by PH3 staining (B). No cell division was detected if paclitaxel was injected (C). (D, E) 72 h after paclitaxel treatment, BrdU was injected. (D) DMSO did not affect DNA duplication and scale formation. (E) Paclitaxel injection did not inhibit DNA duplication, but few scales were detected. (F) A summary of the importance of the second wave of cell division to scale formation. The red bar indicates a scale. The nucleus is drawn in blue. Bar: (A) 5 mm; (B-E) 20 μm.

Figure 4. Apoptosis of one daughter cell after the second wave of asymmetrical cell division. BrdU was injected at P-3:0 h. BrdU and TUNEL staining indicate DNA duplication and apoptosis respectively either by tissue section (A-D) or directly (E-H). DAPI was used to counter-stain nuclei (A, E). BrdU is labeled in green (B, F) and TUNEL is labeled in red (C, C`). These images were merged to show the co-localization of green and red fluorescence (D, H). The arrows point to the granules exhibiting the co-localization of BrdU and TUNEL signals. (I) A summary of the fate of daughter cells derived from the second wave of asymmetrical cell division. The red bar indicates a scale. The nucleus is drawn in blue. Bar: 20 μm.
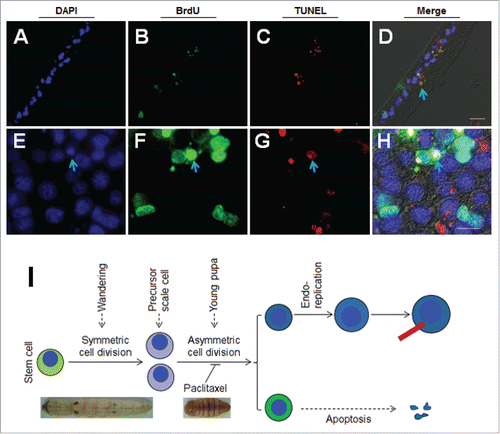
Figure 4. Apoptosis of one daughter cell after the second wave of asymmetrical cell division. BrdU was injected at P-3:0 h. BrdU and TUNEL staining indicate DNA duplication and apoptosis respectively either by tissue section (A-D) or directly (E-H). DAPI was used to counter-stain nuclei (A, E). BrdU is labeled in green (B, F) and TUNEL is labeled in red (C, C`). These images were merged to show the co-localization of green and red fluorescence (D, H). The arrows point to the granules exhibiting the co-localization of BrdU and TUNEL signals. (I) A summary of the fate of daughter cells derived from the second wave of asymmetrical cell division. The red bar indicates a scale. The nucleus is drawn in blue. Bar: 20 μm.

Figure 5. Influence of 20E on scale formation is stage- and dose-dependent. (A) Influence of 20E on scale formation is dose-dependent. Different amounts of 20E were injected into each pupa at P-0:20 h. And at A-1, the adults were compared. When the amount of 20E injected was increased, the scales became short. (B) Influence of 20E on scale formation is stage-dependent. Approximately 15 μg of 20E was injected into each pupa at the indicated time points. Injection of 20E at P-0:20 h (a) significantly inhibited the formation of scales. When the injection time was postponed, scale lengths were longer (b, c, d). Scale formation was dose-dependently influenced. (C) Comparison of BrdU-incorporation at P-2 (a-d) and nuclei sizes at P-4 (e-h) after different amounts of 20E were injected at P-0:20 h. BrdU was injected 3 h ahead of sampling time. With 20E increased, the number of BrdU-positive cells was decreased at P-2 (a-d). At P-4, large nuclei were observed with DMSO injection (e). When different amounts of 20E were injected, there were fewer large nuclei (f-h). (D) Detection of DNA duplication at different time points after injection of DMSO (a-d) or 15 μg of 20E (e-h) at P-0:20 h. At P-1:12 h, the number of BrdU-positive cells in pairs were almost the same between the DMSO (a) and 20E (e) injection. At P-2, more BrdU-positive cells were observed in the DMSO-injected (b) than in 20E-injected larvae (f). Bar: (A-B) 5 mm; (C-D) 70 μm.
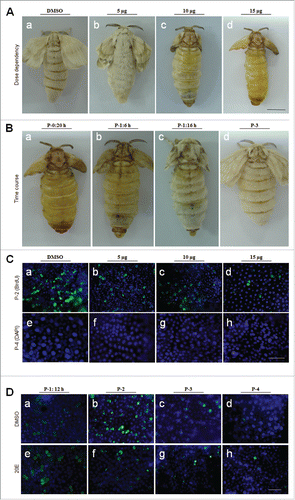
Figure 5. Influence of 20E on scale formation is stage- and dose-dependent. (A) Influence of 20E on scale formation is dose-dependent. Different amounts of 20E were injected into each pupa at P-0:20 h. And at A-1, the adults were compared. When the amount of 20E injected was increased, the scales became short. (B) Influence of 20E on scale formation is stage-dependent. Approximately 15 μg of 20E was injected into each pupa at the indicated time points. Injection of 20E at P-0:20 h (a) significantly inhibited the formation of scales. When the injection time was postponed, scale lengths were longer (b, c, d). Scale formation was dose-dependently influenced. (C) Comparison of BrdU-incorporation at P-2 (a-d) and nuclei sizes at P-4 (e-h) after different amounts of 20E were injected at P-0:20 h. BrdU was injected 3 h ahead of sampling time. With 20E increased, the number of BrdU-positive cells was decreased at P-2 (a-d). At P-4, large nuclei were observed with DMSO injection (e). When different amounts of 20E were injected, there were fewer large nuclei (f-h). (D) Detection of DNA duplication at different time points after injection of DMSO (a-d) or 15 μg of 20E (e-h) at P-0:20 h. At P-1:12 h, the number of BrdU-positive cells in pairs were almost the same between the DMSO (a) and 20E (e) injection. At P-2, more BrdU-positive cells were observed in the DMSO-injected (b) than in 20E-injected larvae (f). Bar: (A-B) 5 mm; (C-D) 70 μm.

Figure 6. Injection of 20E did not inhibit integument cell division but did inhibit DNA duplication. Approximately 15 μg of 20E was injected into each pupa at P-0: 20 h. (A-C) Detection of integument cell division after PH3 staining. Integument cell division was not influenced by 20E injection as assayed at P-1:12 h. (D-I) 20E inhibition of DNA duplication and scale formation. At P-2:12 h, new scales were compared between DMSO (D-F) and 20E (G-I) injection. The arrows point to scales that appear in different sizes. (J) Different amounts of 20E were injected into pupae at P-0:20 h. Approximately 18 h later, integuments were sampled for qRT-PCR. Injection of 20E affected the transcription of cell cycle related genes. Each column represents the mean ± S.E.M. of at least three independent experiments (K) A summary of the development of scale-secreting cells. A sudden increase of 20E in young pupae deters scale production. Bar: 35 μm.
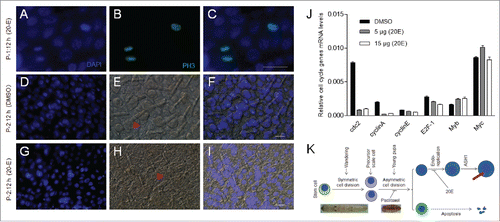
Figure 6. Injection of 20E did not inhibit integument cell division but did inhibit DNA duplication. Approximately 15 μg of 20E was injected into each pupa at P-0: 20 h. (A-C) Detection of integument cell division after PH3 staining. Integument cell division was not influenced by 20E injection as assayed at P-1:12 h. (D-I) 20E inhibition of DNA duplication and scale formation. At P-2:12 h, new scales were compared between DMSO (D-F) and 20E (G-I) injection. The arrows point to scales that appear in different sizes. (J) Different amounts of 20E were injected into pupae at P-0:20 h. Approximately 18 h later, integuments were sampled for qRT-PCR. Injection of 20E affected the transcription of cell cycle related genes. Each column represents the mean ± S.E.M. of at least three independent experiments (K) A summary of the development of scale-secreting cells. A sudden increase of 20E in young pupae deters scale production. Bar: 35 μm.

Figure 7. 20E inhibits scale formation via BR-C Z2 which down-regulates the expression of scale protein ASH1. (A) ASH1 transcription during different developmental stages. Silkworm larvae at IV-M (4th molting stage), V-1 and different pupal stages were assayed. After pupation, the transcription of ASH1 is up-regulated within the first 24 h, with the level of ASH1 decreasing after P-1:0 h. (B) Injection of 20E significantly inhibited ASH1 transcription. 20E was injected at P-0:20 h and integuments were sampled at the indicated stages for comparison. 20E significantly decreased ASH1 transcription at each stage. (C) Addition of 20E significantly inhibited ASH1 expression in vitro. The ASH1 promoter was combined with the luciferase gene in the pGL3 plasmid for over-expression in S2 cells. With 20E added, luciferase activity was significantly decreased when compared with DMSO treatment. (D) BR-C Z2, BR-CZ2-GFP and GFP (control) were co-expressed with the above pGL3 plasmid, respectively. Over-expression of BR-C Z2 or BR-C Z2-GFP significantly inhibited ASH1 expression. Each column represents the mean ± S.E.M. of at least three independent experiments. (E) A model of scale formation. An integument stem cell divides into two similar daughter cells after symmetric cell division during the wandering stage. In young pupae, the precursor scale cells then experience asymmetric cell division. One cell undergoes apoptosis and the other one experiences several rounds of endoreplication to become the scale secreting cell. When the titer of 20E is increased ahead of the appropriate stage, DNA duplication and scale production in scale secreting cells are inhibited. The red bar indicates a scale. The nucleus is drawn in blue.
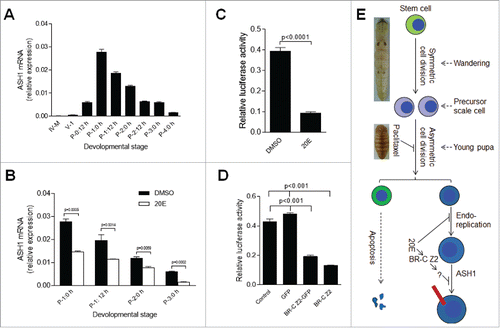
Figure 7. 20E inhibits scale formation via BR-C Z2 which down-regulates the expression of scale protein ASH1. (A) ASH1 transcription during different developmental stages. Silkworm larvae at IV-M (4th molting stage), V-1 and different pupal stages were assayed. After pupation, the transcription of ASH1 is up-regulated within the first 24 h, with the level of ASH1 decreasing after P-1:0 h. (B) Injection of 20E significantly inhibited ASH1 transcription. 20E was injected at P-0:20 h and integuments were sampled at the indicated stages for comparison. 20E significantly decreased ASH1 transcription at each stage. (C) Addition of 20E significantly inhibited ASH1 expression in vitro. The ASH1 promoter was combined with the luciferase gene in the pGL3 plasmid for over-expression in S2 cells. With 20E added, luciferase activity was significantly decreased when compared with DMSO treatment. (D) BR-C Z2, BR-CZ2-GFP and GFP (control) were co-expressed with the above pGL3 plasmid, respectively. Over-expression of BR-C Z2 or BR-C Z2-GFP significantly inhibited ASH1 expression. Each column represents the mean ± S.E.M. of at least three independent experiments. (E) A model of scale formation. An integument stem cell divides into two similar daughter cells after symmetric cell division during the wandering stage. In young pupae, the precursor scale cells then experience asymmetric cell division. One cell undergoes apoptosis and the other one experiences several rounds of endoreplication to become the scale secreting cell. When the titer of 20E is increased ahead of the appropriate stage, DNA duplication and scale production in scale secreting cells are inhibited. The red bar indicates a scale. The nucleus is drawn in blue.

Reprints and Corporate Permissions

Please note: Selecting permissions does not provide access to the full text of the article, please see our help page How do I view content?

To request a reprint or corporate permissions for this article, please click on the relevant link below:

Academic Permissions

Please note: Selecting permissions does not provide access to the full text of the article, please see our help page How do I view content?

Obtain permissions instantly via Rightslink by clicking on the button below:

If you are unable to obtain permissions via Rightslink, please complete and submit this Permissions form. For more information, please visit our Permissions help page.