3,050
Views
19
CrossRef citations to date
0
Altmetric
Extra Views

Death by over-eating: The Gaucher disease associated gene GBA1, identified in a screen for mediators of autophagic cell death, is necessary for developmental cell death in Drosophila midgut

ORCID Icon, , , ORCID Icon, ORCID Icon, & show all
Pages 2003-2010 | Received 09 Aug 2017, Accepted 11 Sep 2017, Published online: 09 Oct 2017

Figures & data

Figure 1. Resveratrol induces excessive autophagy in A549 cells. A. Transmission EM of control A549 cells. B-D. Transmission EM of A549 cells treated with 200 µM RSV for 48 h. AV, autophagic vacuoles, mito, mitochondria, PNS, perinuclear space.
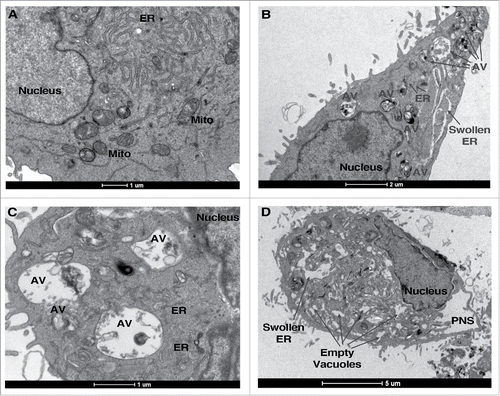
Figure 1. Resveratrol induces excessive autophagy in A549 cells. A. Transmission EM of control A549 cells. B-D. Transmission EM of A549 cells treated with 200 µM RSV for 48 h. AV, autophagic vacuoles, mito, mitochondria, PNS, perinuclear space.

Figure 2. Gba1a is necessary for midgut regression in Drosophila larva. (A) Schematic representation of the Gba1a and GBa1b gene loci on Drosophila chromosome 3. (B) Expression levels of Gba1a and Gba1b in larval midgut and adult head were determined by quantitative real-time PCR. Assays were performed in triplicate and normalized to RpL32/rp49 as an internal control. (C) Percent knockdown of Gba1a, Atg1 and Atg18 in the late third instar larvae (−4 h to −1 h RPF). The indicated siRNA constructs were expressed in larvae via the midgut driver NP1-Gal4. Transcript levels were measured by quantitative RT-PCR, normalized to the internal control RpL32/rp49, and are presented as relative KD of expression in comparison to expression in the NP1-Gal4 line. (D) Morphology of midguts at 0 h RPF and +4 h RPF comparing control (NP1-Gal4) pupae with pupae from NP1-Gal4>UAS-Gba1a RNAi #1 (siGba1a#1), NP1-Gal4>UAS-Gba1a RNAi #2 (siGba1a#2), NP1-Gal4>UAS-Atg1 RNAi (siAtg1) and NP1-Gal4>UAS-Atg18 RNAi (siAtg18) crosses. Arrows indicate gastric caeca at 0 h; double arrows, normal regression of gastric caeca at 4 h; arrowheads, persistent gastric caeca in KD larvae. Scale bar represents 200 µm. (E) Quantitation of gastric caeca size at +4 h RPF. Data represents mean ± SD of more than 10 midguts per genotype; statistical significance was assessed using one-way analysis of variance (ANOVA) followed by Tukey's post hoc test, **P < 0.01; ***P < 0.001.
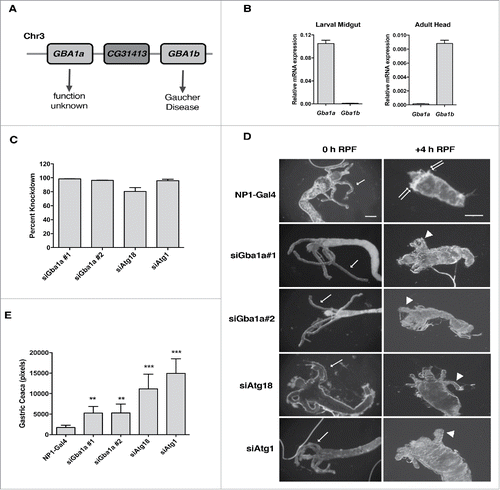
Figure 2. Gba1a is necessary for midgut regression in Drosophila larva. (A) Schematic representation of the Gba1a and GBa1b gene loci on Drosophila chromosome 3. (B) Expression levels of Gba1a and Gba1b in larval midgut and adult head were determined by quantitative real-time PCR. Assays were performed in triplicate and normalized to RpL32/rp49 as an internal control. (C) Percent knockdown of Gba1a, Atg1 and Atg18 in the late third instar larvae (−4 h to −1 h RPF). The indicated siRNA constructs were expressed in larvae via the midgut driver NP1-Gal4. Transcript levels were measured by quantitative RT-PCR, normalized to the internal control RpL32/rp49, and are presented as relative KD of expression in comparison to expression in the NP1-Gal4 line. (D) Morphology of midguts at 0 h RPF and +4 h RPF comparing control (NP1-Gal4) pupae with pupae from NP1-Gal4>UAS-Gba1a RNAi #1 (siGba1a#1), NP1-Gal4>UAS-Gba1a RNAi #2 (siGba1a#2), NP1-Gal4>UAS-Atg1 RNAi (siAtg1) and NP1-Gal4>UAS-Atg18 RNAi (siAtg18) crosses. Arrows indicate gastric caeca at 0 h; double arrows, normal regression of gastric caeca at 4 h; arrowheads, persistent gastric caeca in KD larvae. Scale bar represents 200 µm. (E) Quantitation of gastric caeca size at +4 h RPF. Data represents mean ± SD of more than 10 midguts per genotype; statistical significance was assessed using one-way analysis of variance (ANOVA) followed by Tukey's post hoc test, **P < 0.01; ***P < 0.001.

Figure 3. Model showing effects of different expression levels of GBA1. Loss of GBA1 expression, such as that which results from mutations associated with Gaucher Disease or Parkinson Disease, leads to GlcCer accumulation, lysosomal dysfunction, defects in autophagy, and eventual accumulation of α-synuclein inclusions, resulting in neurodegeneration. Enhanced GBA1 expression, such as that observed following RSV treatment, leads to elevations in ceramide and its sphingolipid metabolites, induction of autophagy and autophagic cell death.
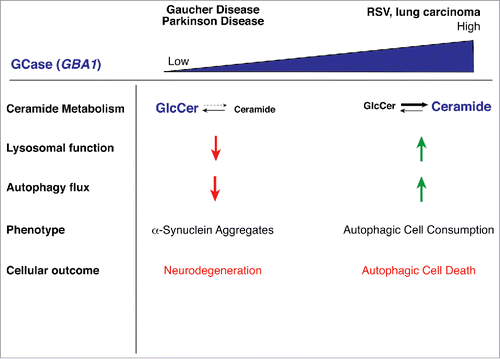
Figure 3. Model showing effects of different expression levels of GBA1. Loss of GBA1 expression, such as that which results from mutations associated with Gaucher Disease or Parkinson Disease, leads to GlcCer accumulation, lysosomal dysfunction, defects in autophagy, and eventual accumulation of α-synuclein inclusions, resulting in neurodegeneration. Enhanced GBA1 expression, such as that observed following RSV treatment, leads to elevations in ceramide and its sphingolipid metabolites, induction of autophagy and autophagic cell death.