Figures & data
Figure 1. Short-term CHX treatment blocks DNA replication. (A) Representative images of U2OS cells treated with 10 μg/ml CHX (36 μM) or 2 mM HU for the timepoints indicated. Cells were subsequently pulsed with 10 μM EdU for 20 minutes (in presence of inhibitors), followed by fixation and fluorescent labeling. (B) Quantification of (A) as the percentage of 100 cells counted in each experiment (n = 3). (C) Schematic representation of experimental setup of the fiber assay and representative images of DNA fibers. (D) Average replication speed of control or CHX (10 μg/ml) treated U2OS cells (n = 2). (E) U2OS cells were left untreated or treated with 0.4 μM aphidicolin (APH) for 24 hours. When indicated, cells were pre-treated with 10 μg/ml CHX or 2 mM HU 10 minutes prior to APH addition and kept in the media for the duration of the experiment. Cells were fixed and immunostained for 53BP1. Note that cells treated with HU and APH still induce 53BP1 foci (as seen in the image), whereas 53BP1 nuclear body formation is diminished. (F) Quantification of immunofluorescence in (E) as the percentage of 100 cells containing >10 53BP1 nuclear bodies (NBs) in each experiment (n = 2). The error bars depict standard deviation; *P ≤ 0.05, ** P < 0.01, ***P ≤ 0.001 as determined by Student's t-test. See also Figure S1.
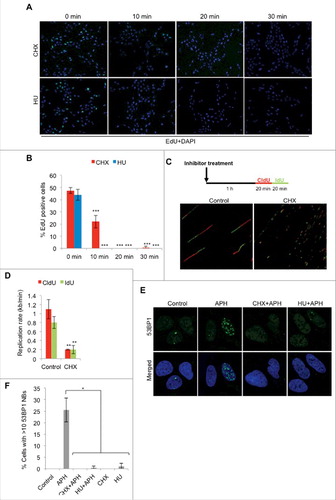
Figure 2. CHX treatment does not result in ssDNA formation, checkpoint activation or DNA damage. (A) Representative images of U2OS cells treated with 10 μg/ml CHX or 2 mM HU for the indicated timepoints and stained for RPA32. Cells were pre-extracted with CSK buffer (10 mM Pipes, pH 7.0, 100 mM NaCl, 300 mM sucrose, and 3 mM MgCl2, 0.7% Triton X-100) for 5 minutes prior to fixation. (B) Quantification of RPA32 positive cells (A), (n = 3). (C) U2OS cells were either left untreated or treated with CHX or HU for the timepoints indicated followed by Western blot probed with p-Chk1-S345, Chk1 and β-actin antibodies. (D) Representative images of U2OS cells treated with 10 μg/ml CHX or 2 mM HU for the indicated timepoints and stained for γH2AX. (E) Quantification of γH2AX positive cells (D), (n = 2). (F) and (G) DNA damage in U2OS assessed by the comet assay following treatment with 10 μg/ml CHX or 2 mM HU for 24 hours. Representative images (F) and quantification of tail moment (G). The error bars depict standard deviation; *P ≤ 0.05, **P ≤ 0.01, ***P ≤ 0.001 as determined by Student's t-test. See also Figure S3.
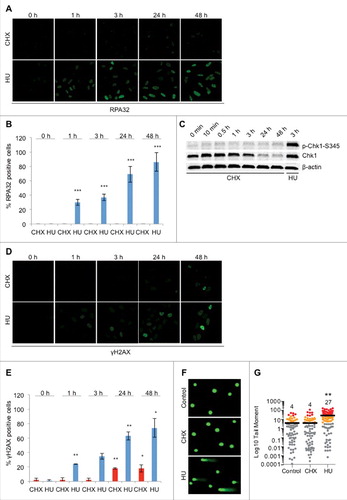
Figure 3. Short-term cellular exposure to CHX is rapidly reversed whereas long-term exposure is toxic. (A) U2OS cells were treated with 10 μg/ml CHX or 2 mM HU for 1 hour, washed and released into fresh media for 1 or 5 hours, pulsed with 10 μM EdU for 20 minutes, followed by fixation and fluorescent labeling. (B) Quantification of relative fluorescence intensities in (A) (n = 2). Viability as determined by resazurin in U2OS cells (C) or immortalized BJ-hTERT cells (D) exposed to 10 μg/ml CHX or 2 mM HU for 24, 48 or 72 hours (n = 3). (E) Clonogenic survival assays of U2OS cells treated with 10 μg/ml CHX or 2 mM HU for 48 hours, followed by trypsinization and re-seeding of 500 cells in a 6-well format. After 10 days, cells were fixed and stained in 4% methylene blue-MeOH and quantified (n = 2). The error bars depict standard deviation; *P ≤ 0.05, **P ≤ 0.01, ***P ≤ 0.001 as determined by Student's t-test. See also Figure S4.
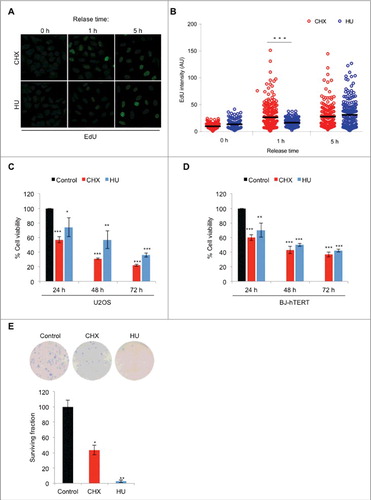
Figure 4. CHX does not immediately deplete replicative polymerases but disrupts new production of histones. (A) U2OS cells were either left untreated or treated with CHX for the timepoints indicated followed by Western blot probed with the specified antibodies. (B) Schematic protocol and representative images for fluorescent SNAP-tag labeling of U2OS cells stably expressing histone H3.1 or H3.3. Cells were quenched by DMSO (panel 1) or 0.2 μM blocking agent for 20 minutes (panel 2 and 3), labeled with 1 μM TMR for 30 minutes after a 3 hour release into fresh media +/- 10 μg/ml CHX. The contrast of the images in the middle panel of this figure has been equally enhanced in order to visualize the production of new histones after release from the quenching agent (panel 2), whereas the upper panel is unaltered. Furthermore, figure S4B and C (panel 3) shows cells without enhanced contrast, where arrows instead indicate new histone production. (C) Effect of HU on new histone H3.1 and H3.3 production via quenching of pre-existing histones using 0.2 μM blocking agent for 20 minutes, labeling with 1 μM TMR for 30 minutes after a 3 hour release into fresh media +/- 2 mM HU. (D) U2OS cells were treated with 10 μg/ml CHX or 2 mM HU for 24 hours and stained for RPA32. (E) U2OS cells were treated with 10 μg/ml CHX for 24 hours and co-stained for RPA32 and PML. See also Figure S5.
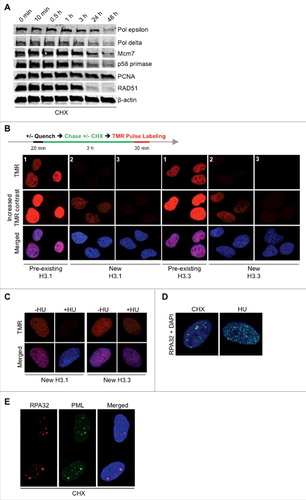
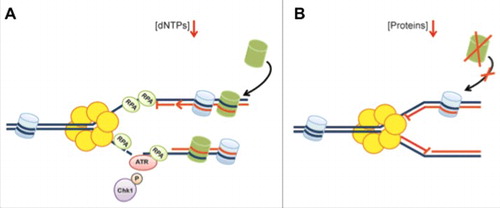
Figure 5. Overview of the cellular responses associated with protein and dNTP deprivation. (A) Replication fork arrest upon nucleotide deprivation is associated with replication fork uncoupling resulting in ssDNA generation, DNA damage and ATR-mediated checkpoint activation. (B) Replication fork arrest caused by protein deprivation occurs rapidly without subsequent exposure of ssDNA or DNA damage formation. This is likely caused by insufficient supply of newly synthesized histones (in green) and reduced DNA unwinding. Replication is readily resumed following short-term protein deprivation.