Figures & data
Figure 1. Parkin focus formation in response to acute SR, CR or FR. (A) Images of parkin staining in non-irradiated control cells and TIG-3 cells exposed to acute SR, CR, or FR for 24hours after IR. The scale bar represents 50 µm. Percentage of cells with parkin foci in TIG-3 and MRC-5 cells was shown for each irradiation method in the graph. (B) Percentage of cells with parkin foci in TIG-3 and MRC-5 cells was shown for acute SR at the indicated doses on the left graph. Percentage of cells with parkin foci in AT5BIVA (ATM-deficient) and AT5BIVA/ATM-wt is shown on the right graph. (C) Monitoring of parkin-positive cells during FR for 31days in TIG-3 and MRC-5 cells. Asterisks indicate the significant difference of the number of cells with parkin foci in irradiated cells as compared with non-irradiated cells. (D) Western blotting for parkin, complex V and PCNA in cytosolic and mitochondrial fraction of 0FR and 31FR cells.
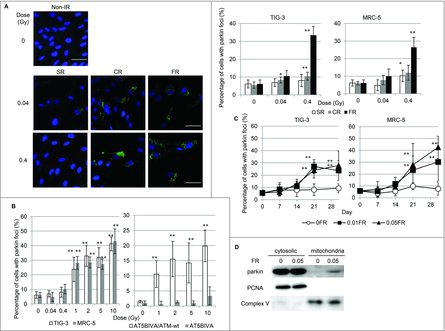
Figure 2. Mitochondrial membrane potential and COX activity after IR. (A) FACS results for JC-1 staining after SR or long-term FR in TIG-3 and MRC-5 cells. Cells were stained with JC-1 at 24hours after SR or last FR. Asterisks indicate the significant difference of the FL2/FL1 ratio in irradiated cells as compared with that of non-irradiated cells. (B) COX activity at 24hours after SR or last FR in TIG-3 and MRC-5 cells. Asterisks indicate the significant difference of the COX activity in irradiated cells as compared with that of non-irradiated cells. (C) ATP levels at 24hours after last FR in TIG-3 and MRC-5 cells. Asterisks indicate the significant difference of the amounts of ATP in irradiated cells as compared with that of non-irradiated cells.
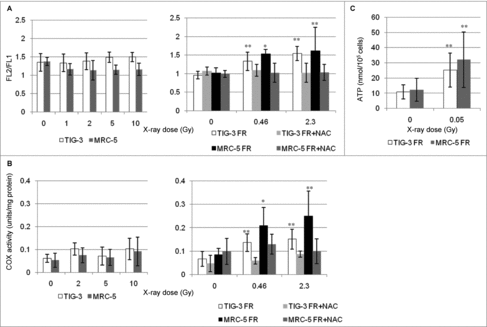
Figure 3. γ-H2AX and Rad51 foci formation after IR. (A) Images of γ-H2AX (red) and Rad51 (green) positive cells at 24hours after SR, CR, or FR in MRC-5 cells. DNA was stained with Hoechst. The scale bar represents 50 µm. (B) The percentage of γ-H2AX and Rad51 double-positive cells is shown for each irradiation method in the graph. Asterisks indicate the significant difference of the percentage of double-positive cells in irradiated cells as compared with that of non-irradiated cells.
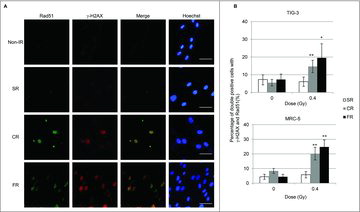
Figure 4. ROS generation (A) FACS results for MitoSOX-red staining after 1 Gy of SR in TIG-3 and MRC-5 cells at the indicated time. The relative fluorescence intensity values of MitoSOX-red staining normalized to non-irradiated controls are shown. Asterisks indicate the significant difference of the relative fluorescence intensity values of the Mitosox staining in irradiated cells as compared with those of non-irradiated cells. (B) FACS results for MitoSOX-red staining in TIG-3 cells treated with rotenone, antimycin A, 2-DG, 1 Gy of SR, 1 Gy+rotenone, 1 Gy+anitimycin A, and 1 Gy+2-DG. Asterisks indicate the significant difference of the relative fluorescence intensity values of the MitoSOX-red staining in cells treated with the indicated reagents as compared with that of non-irradiated cells.
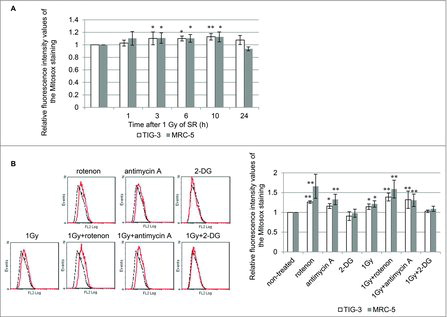
Figure 5. The role of mitochondrial OXPHOS on IR-induced mitochondrial damage. (A) Image of parkin staining in untreated TIG-3 (control) cells, cells treated with the indicated reagents and cells exposed to 1 Gy of SR. DNA was stained with Hoechst. The scale bar represents 50 µm. Percentage of parkin-positive TIG-3 and MRC-5 cells is shown on the graph. Asterisks indicate the significant difference of the percentage of cells with parkin foci in cells treated with the indicated reagents as compared with that of non-irradiated cells. (B) Image of parkin staining in untreated TIG-3 (0FR) cells and 31FR cells treated with indicated reagents. Percentage of parkin-positive 31FR cells was shown on the graph. Asterisks indicate the significant difference of the percentage of 31FR cells with parkin foci in cells treated with the indicated reagents as compared with that of non-irradiated cells
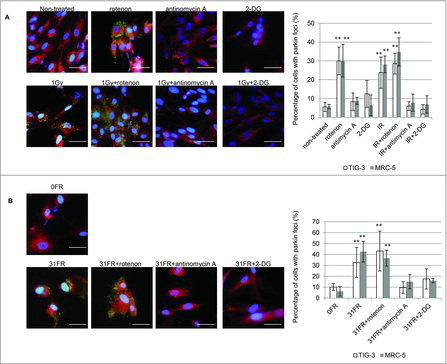
Figure 6. nDNA damage and mitochondrial damage (A) The kinetics of focus formation of γ-H2AX or parkin after 1Gy of SR in TIG-3, MRC-5 cells was shown in the upper panel. Asterisks indicate the significant difference the percentage of γ-H2AX or parkin foci in irradiated cells as compared with those of non-irradiated cells. Percentage of AT5BIVA and AT5BIVA/ATM-wt cells with γ-H2AX or parkin foci after 1Gy of SR was shown in the lower panel. Asterisks indicate the significant difference the percentage of γ-H2AX or parkin foci in ATM-deficient cells as compared with those of ATM-wt reconstituted cells. (B) Cells were irradiated with 1Gy following treatment with mito-TEMPO or KU-55933 for two hours and then were stained with γ-H2AX and parkin at 1hour or 6hours after SR. The percentage of cells with γ-H2AX or parkin foci is shown. Asterisks indicate the significant decrease in the percentage of γ-H2AX or parkin positive cells in cells treated with 1Gy plus mito-TEMPO or 1Gy plus KU-55933 as compared with that of 1Gy-irradiated cells at 1 or 6hours after IR.
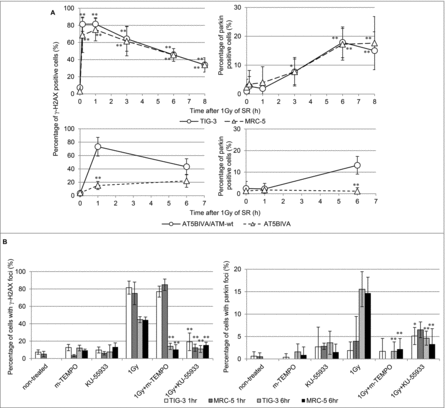
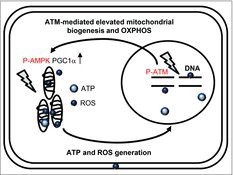
Figure 7. Schematic representation of the relationship between nuclear and mitochondrial damage responses via ATM signaling pathway.