Figures & data
Figure 1. Effect of ATO on cell growth and apoptosis. (A) MTT assay was used to measure cell proliferation in MCF-7 and SK-BR-3 cells after ATO treatment for 72 hours. *P<0.05, **P<0.01, ***P<0.001, compared with control. (B) Apoptotic cell death was examined using Annexin V-FITC/PI method in breast cancer cells after ATO treatment for 48 hours.
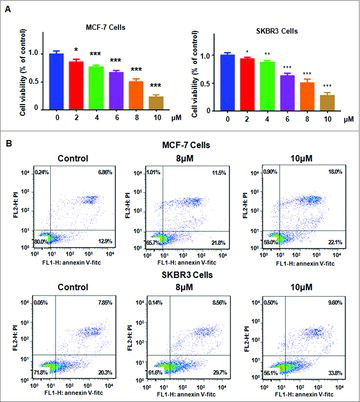
Figure 2. Effect of ATO on cell migration and invasion. (A) Cell migration was determined using Wound healing assay in breast cancer cells after ATO treatment. (B) Quantitative results are illustrated for panel A.**P<0.01, compared with control. (C) Left panel: Cell invasion was measured using Transwell inserts with Matrigel in MCF-7 (top panel) and SK-BR-3 (bottom panel) breast cancer cells after ATO treatment for 24 hours. Right panel: Quantitative results are shown for left panel.**P<0.01, ***P<0.001, compared with control.
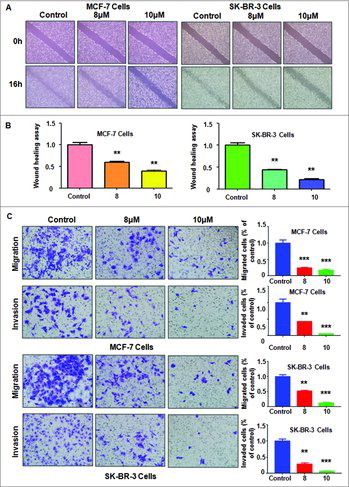
Figure 3. Effect of let-7a mimics on cell growth and apoptosis. (A) The expression of let-7a was measured by real-time RT-PCR in MCF-7 and SK-BR-3 cells after 8 μM ATO treatment for 72 hours. ***P<0.001, compared with control. (B) MTT assay was conducted in breast cancer cells after ATO treatment or let-7a mimics or the combination. *P<0.05, compared with control; #P<0.05, compared with ATO alone or let-7a mimics alone. ATO: 8 μM ATO; Mimics: let-7a mimics: Both: 8 μM ATO plus let-7a mimics. (C) Cell apoptosis was detected by Annexin V-FITC/PI method in MCF-7 and SK-BR-3 cells after ATO treatment or let-7a mimics or the combination. ATO: 8 μM ATO; Mimics: let-7a mimics: Both: 8 μM ATO plus let-7a mimics.
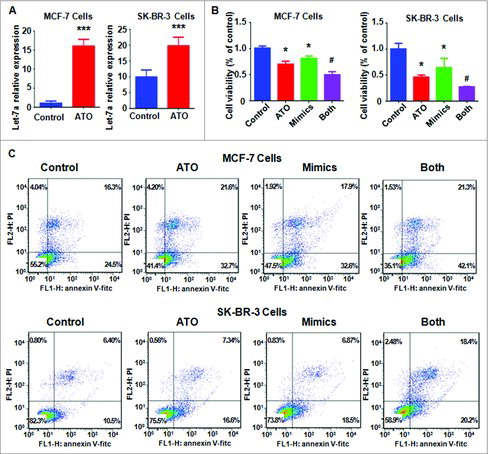
Figure 4. Effect of let-7a on cell motility. (A) Left panel: Cell migration was measured using Wound-healing assay in MCF-7 breast cancer cells after ATO treatment or let-7a mimics or the combination. Right panel: Quantitative results are illustrated for left panel. **P<0.01, compared with control; #P<0.05, compared with ATO alone or let-7a mimics alone. ATO: 8 μM ATO; Mimics: let-7a mimics: Both: 8 μM ATO plus let-7a mimics. (B) Left panel: Wound-healing assay was performed to measure the cell migration in SK-BR-3 cells after ATO treatment or let-7a mimics or the combination. Right panel: Quantitative results are illustrated for left panel. **P<0.01, compared with control; #P<0.05, compared with ATO alone or let-7a mimics alone.
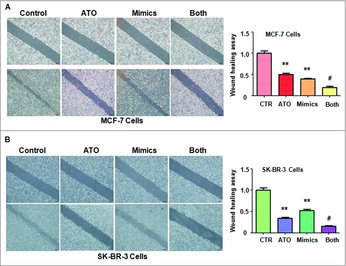
Figure 5. Effect of let-7a on cell migration and invasion. (A-B) Left panel: The cell migration and invasion was measured using Transwell inserts with or without Matrigel in MCF-7 (A) and SK-BR-3 (B) breast cancer cells after ATO treatment or let-7a mimics or the combination for 24 hours. ATO: 8 μM ATO; Mimics: let-7a mimics: Both: 8 μM ATO plus let-7a mimics. Right panel: Quantitative results are illustrated for left panel. *P<0.05, compared with control; #P<0.05, compared with ATO alone or let-7a mimics alone.
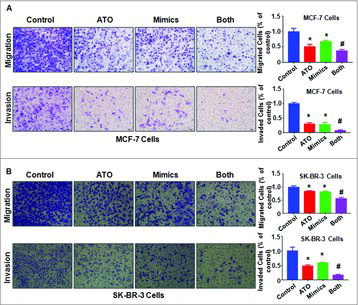
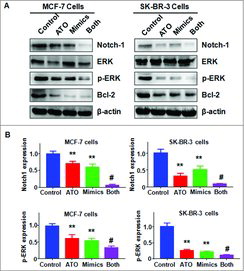
Figure 6. Effect of ATO on the expression of Notch-1 pathway. (A) The expression of Notch-1, ERK, and Bcl-2 was measured by Western blotting analysis in breast cancer cells after ATO treatment or let-7a mimics or the combination. ATO: 8 μM ATO; Mimics: let-7a mimics: Both: 8 μM ATO plus let-7a mimics. (B) Quantitative results are illustrated for panel A. **P<0.01, compared with control; #P<0.05, compared with ATO alone or let-7a mimics alone.