Figures & data
Figure 1. TMZ-resistant cells exhibited EMT phenotype. A. MTT assay was conducted in parental and TMZ-resistant glioma cells. * P<0.05 vs TR cells. B. Cell morphology was observed by microscopy in parental and TMZ-resistant cells. C. Top panel: Invasion assay was performed to measure the invasive capacity in parental and TMZ-resistant glioma cells. Bottom panel: Quantitative results are illustrated for top panel. * P<0.05 vs control. D. Cell attachment and detachment assays were assessed in parental and TMZ-resistant cells. * P<0.05 vs control.
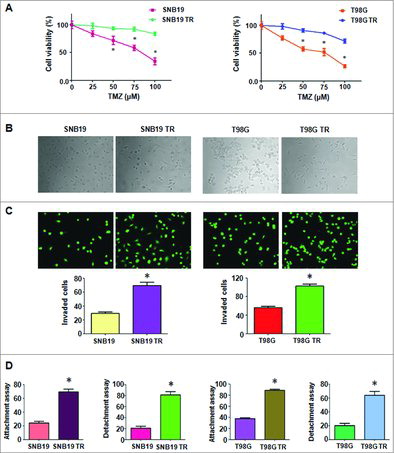
Figure 2. TMZ-resistant cells had enhanced migrate capacity and EMT marker changes.A. Wound healing assays were used to detect the motility in TMZ-resistant cells. B. The mRNA levels of EMT markers were measured by real-time RT-RCR. * P<0.05 vs control.
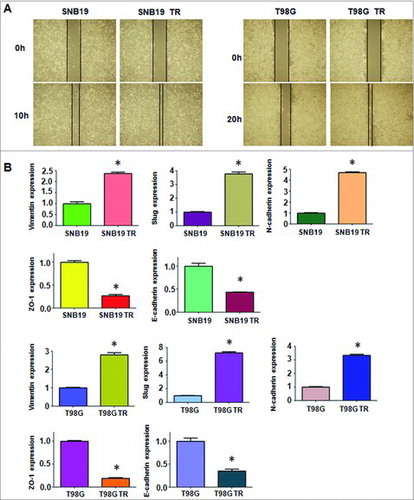
Figure 3. TMZ-resistant cells hade EMT marker changes. A. Left panel: Western blotting analysis was used to detect the expression of ZO-1, E-cadherin, N-cadherin, Slug, and Vimentin in SNB19 and SNB19/TR cells. Right panel: Quantitative results are illustrated for left panel. * P<0.05 vs control. B. Left panel: Western blotting analysis was performed to measure the expression of ZO-1, E-cadherin, N-cadherin, Slug, and Vimentin in T98G and T98G/TR cells. Right Panel: Quantitative results are illustrated for left panel. * P<0.05 vs control.
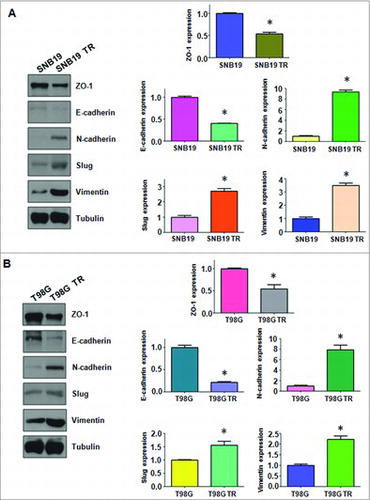
Figure 4. TMZ-resistant cells had high expression of CDC20. A. Real-time RT-PCR assay was performed to detect the expression of CDC20 in parental and TMZ-resistant cells. * P<0.05 vs control. B. Western blotting analysis was performed to detect the expression of CDC20 in parental and TMZ-resistant cells. C. Western blotting analysis was performed to detect the efficacy of CDC20 shRNA transfection. D. Cell morphology was taken by microscopy in TMZ-resistant cells transfected with CDC20 shRNA. CS: Control shRNA; DS: CDC20 shRNA. E. Invasion assay were performed in TMZ-resistant cells transfected with CDC20 shRNA. CS: Control shRNA; DS: CDC20 shRNA.
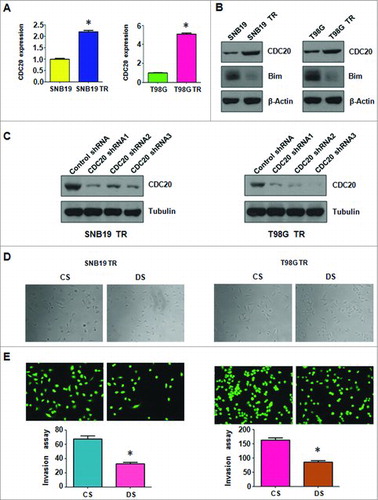
Figure 5. Depletion of CDC20 inhibited motility and enhanced TMZ sensitivity in TMZ-resistant cells. A. Wound healing assays were used to detect the motility in TMZ-resistant cells transfected with CDC20 shRNA B. Cell attachment and detachment assays were measured in TMZ-resistant cells transfected with CDC20 shRNA. * P<0.05 vs control. CS: control shRNA; DS: CDC20 shRNA. C. MTT assay was performed in TMZ-resistant cells treated with CDC20 shRNA. CS: control shRNA; DS: CDC20 shRNA. *, P<0.05 compared with control shRNA.
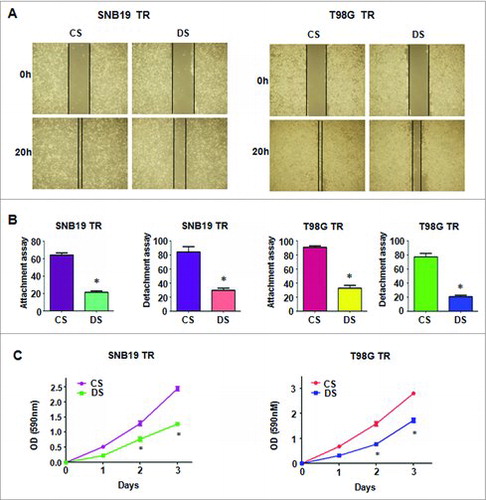
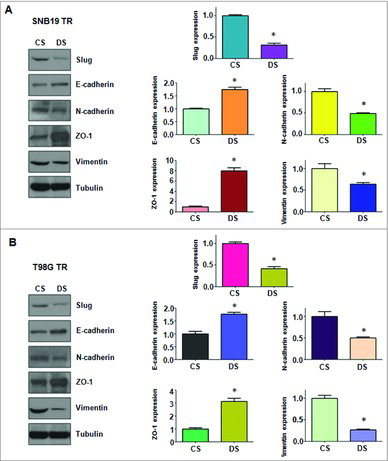
Figure 6. Depletion of CDC20 regulated protein levels of EMT markers in TMZ-resistant cells. A. Left panel: Western blotting analysis was used to detect the expression of EMT markers in SNB19/TR cells after CDC20 depletion. Right panel: Quantitative results are illustrated for left panel. * P<0.05 vs control. B. Left panel: Western blotting analysis was performed to measure the expression of EMT markers in T98G/TR cells after CDC20 depletion. Right Panel: Quantitative results are illustrated for left panel. * P<0.05 vs control.