Figures & data
Figure 1. ONC201 induced caspase-dependent apoptosis in leukemia is accompanied by inhibition of Akt, IAP and Bcl-2 family members. (A) GI50 of ONC201 in viability assay with indicated AML, ALL and CML cell lines at 72 h post-treatment with concentrations from 78 nM up to 20 µM. (B) Representative dose response curves for (A). (C) Western blot for indicated proteins in DMSO/ONC201-treated AML Kasumi-1 cells at indicated concentrations and time points. (D) % Apoptosis (Sub-G1 cells) in DMSO/ONC201-treated (5 µM, 48h) with or without caspase inhibitor Z-VAD-FMK in ALL Jurkat and Reh cells. (E) Western blot analysis of ONC201-treated ALL Reh and (F) Jurkat cells at indicated concentrations and time point.
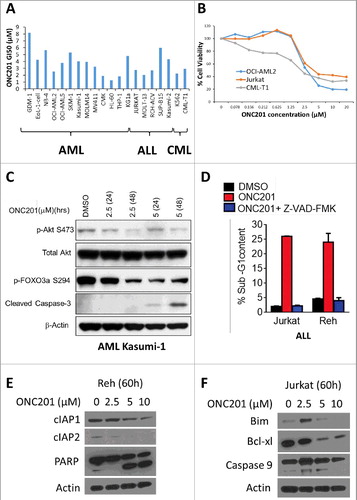
Figure 2. ONC201 induced apoptosis in MM involved induction of ISR and IAP inhibition. Dose response curve for cell viability assay of ONC201-treated (A) RPMI-8226, (B) MM.1S and (C) dexamethasone resistant MM.1R cells at indicated concentrations and time points. (D) % Apoptosis (Sub-G1 cells, fold change) in DMSO/ONC201-treated (5 µM, 48h) MM.1S and MM.1R cells. (E) Western blot for indicated proteins in ONC201-treated (0.625 µM) MM.1S cells at indicated time points. (F) Western blot for indicated proteins in ONC201-treated (48 h) KMS18 and MM.1S cells at indicated concentrations.
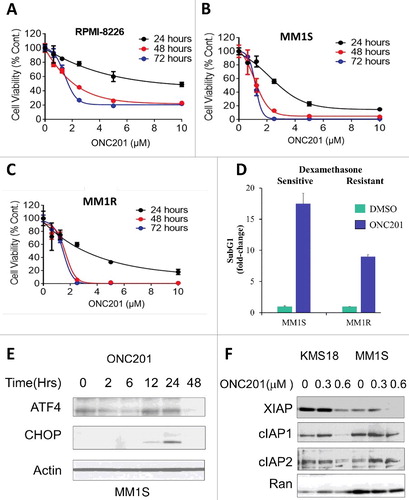
Figure 3. ONC201 inhibited lymphoma cell viability independent of subtype, triggered an ISR and downregulated cyclin D1. (A) GI50 of ONC201 in viability assay with indicated ALCL, Burkitt's lymphoma, CTCL, DLBCL, MCL, NS and other lymphoma cell lines at 72 h post-treatment with concentrations from 78 nM up to 20 µM. (B) Western blot for indicated proteins in ONC201-treated (1.25 µM) Pfeiffer DLBCL cells at indicated time points. (C) % Cell viability curves at indicated concentrations and time points for ONC201 in primary MCL cells. (D) Cyclin D1 immunofluorescence for patient-derived MCL cells treated with DMSO or 5 µM ONC201 for 72 h. DAPI is used a nuclear stain.
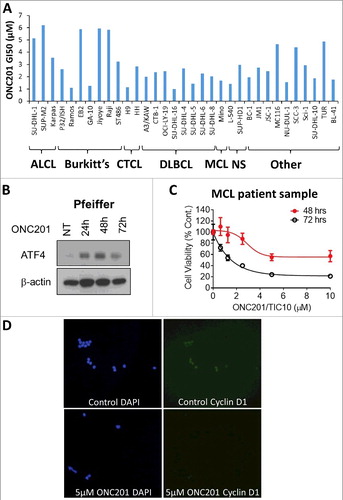
Figure 4. ONC201 combines synergistically with cytarabine in vitro and in vivo. Representative % cell viability bar chart at indicated concentrations and combination index (CI) versus fraction affected (Fa) plots for ONC201 and cytarabine, either as single agent or in combination (72 h) in (A) THP-1 and (B) Kasumi-2 cells. CI < 1 indicates synergism, CI = 1 indicates additive effect and CI > 1 indicates antagonism. Raw data shown in Table S2 and S3. (C) Average tumor volume (cm3) on indicated days post treatment for ONC201 (100 mg/kg, weekly, oral gavage) and cytarabine (75 mg/kg/day on day 1/2/3, every 3 weeks, intraperitoneal injection) either as single agent or in combination in a Ramos Burkitt's lymphoma subcutaneous xenograft model in SCID mice (4 mice per group).
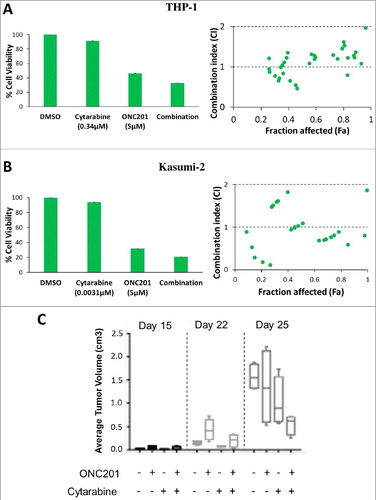
Figure 5. ONC201 combines synergistically with 5-azacytidine in AML in vitro. Representative % cell viability curves at indicated concentrations and combination index (CI) versus fraction affected (Fa) plots for ONC201 and 5-azacytidine (5-aza), either as single agent or in combination (72 h) in (A) HL-60, (B) MOLM14 and (C) MV411 cells. CI < 1 indicates synergism, CI = 1 indicates additive effect and CI > 1 indicates antagonism. Raw data shown in Table S5, S6 and S7.
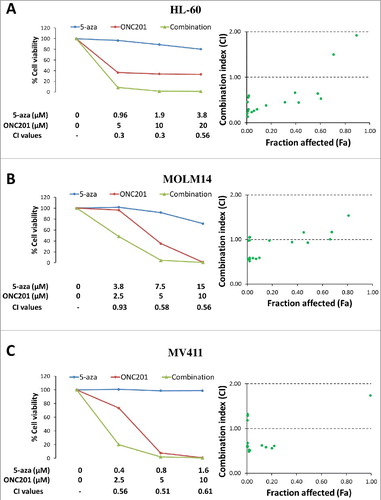
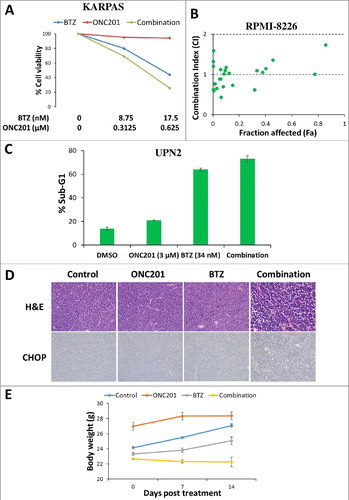
Figure 6. ONC201 combines synergistically with bortezomib in vitro and in vivo. (A) Representative % cell viability curves at indicated concentrations in KARPAS 299 ALCL cells and (B) combination index (CI) versus fraction affected (Fa) plot in RPMI-8226 MM cells, for ONC201 and bortezomib (BTZ) either as single agent or in combination (72 h). (C) % Apoptosis (Sub-G1 cells) in UPN2 MCL cells treated with ONC201 and BTZ at indicated concentrations either as single agent or in combination (72 h). (D) Representative H&E (40X) at end point 3–4 week's post-treatment initiation and CHOP (20X) staining 48 h post treatment initiation for ONC201 (100 mg/kg, weekly, intraperitoneal injection) and BTZ (0.3 mg/kg, twice weekly, intraperitoneal injection) either as single agent or in combination in a Ramos Burkitt's lymphoma subcutaneous xenograft model in SCID mice (7 mice per group). (E) Body weight (g) for mice in (D) at indicated days post treatment.