Figures & data
Figure 1. The effect of ATR inhibitor VE-821 on EMT and migration ability in four kinds of cancer cells. (A, B) Four kinds of cancer cells (PANC-1, MGC-803, HCT-116 and NCI-N87) were treated with 5 μM VE-821 for 48 h. Photos of cellular morphology were taken at × 200 magnification. (C) Four kinds of cancer cells were treated with 5 μM VE-821 for 24 h and 48 h. The expression of E-cadherin, Vimentin and ZEB1 was performed by Western Blotting. Actin was used as loading control. The fold of ZEB1 expression was quantified by Image J. *p<0.05 vs. control 0 h. (D) MGC-803 cells were stained with antibodies to Vimentin (green) and nuclei was stained with DAPI. Images were captured by fluorescence microscopy at × 40 magnification. (E) PANC-1 cells and HCT-116 cells were performed the migration assays as described in Materials and methods. Photos of migrated cells were taken at × 200 magnification. Data are means ± SD in three independent experiments.
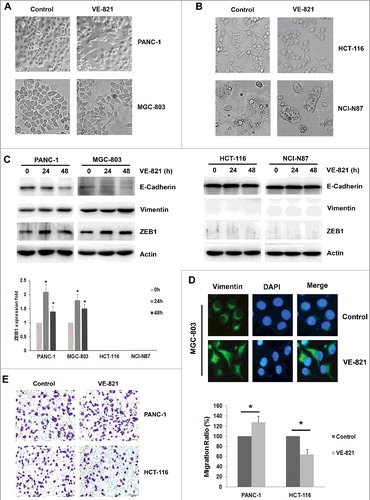
Figure 2. ZEB1 inhibition reverses EMT induces by VE-821 and enhances migration ability. (A, B) PANC-1 cells and MGC-803 cells were transiently transfected with Scrambled Control siRNA or ZEB1 siRNA, then added with 5 μM VE-821 for 48 h. Photos of cellular morphology were taken at × 200 magnification. (C) PANC-1 cells and MGC-803 cells were transiently transfected with Scrambled Control siRNA or ZEB1 siRNA, then added with 5 μM VE-821 for 48 h. The expression of ZEB1, E-cadherin and Vimentin was performed by Western Blotting. (D) PANC-1 cells were transiently transfected with Scrambled Control siRNA or ZEB1 siRNA, then added with 5 μM VE-821 for 24 h. Then migration assays were performed and photos of migrated cells were taken at × 200 magnification. **p<0.01 vs. Scrambled Control.
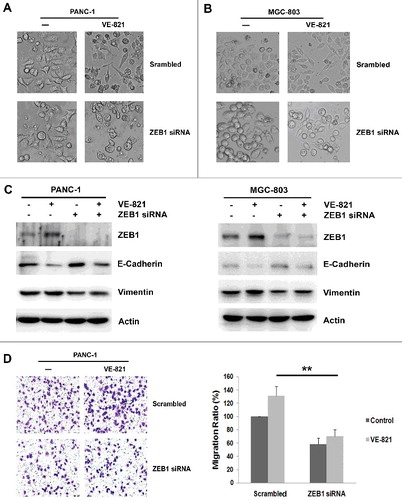
Figure 3. ZEB1 inhibition increases sensitivity of VE-821 in PANC-1 cells and MGC-803 cells. (A) Indicated concentrations of VE-821 (0, 1, 5 and 10 μM) were added to four kinds of cancer cells (PANC-1, MGC-803, HCT-116 and NCI-N87) for 48 h. Cell viability was performed by MTT assay. Results from three independent experiments are shown. (B) PANC-1 cells and MGC-803 cells were transiently transfected with Scrambled Control siRNA or ZEB1 siRNA, then added with 5 μM VE-821 for 48 h. Cell viability was performed by MTT assay. *p<0.05 vs. VE-821 alone. (C, D) PANC-1, MGC-803, HCT-116 and NCI-N87 cells were added to 5μM VE-821 for 24 h and 48 h. The total and phosphorylation expression of AKT and ERK was performed by Western Blotting. (E) PANC-1 cells and MGC-803 cells were transiently transfected with Scrambled Control siRNA or ZEB1 siRNA, then added with 5 μM VE-821 for 24 h. The total and phosphorylation expression of AKT and ERK was performed by Western Blotting. (F) HCT-116 cells were transiently transfected with pcDNA3.1/ZEB1-Flag plasmid or pcDNA3.1 empty control, and expression of ZEB1 was performed by Western Blotting. (G) HCT-116 cells were transiently transfected with pcDNA3.1/ZEB1-Flag plasmid or pcDNA3.1 empty control, then added with 5 μM VE-821 for 24 h. The total and phosphorylation expression of AKT and ERK was performed by Western Blotting.
Figure 4. ZEB1 inhibition promoted Chk1 phosphorylation via increasing TopBP1 expression and induces S-phase arrest. (A) PANC-1 and MGC-803 cells were transfected with Scrambled Control siRNA or two pairs of ZEB1 siRNA, the expression of ZEB1, p-Chk1, total Chk1 and ATR was determined by Western Blotting. (B) MGC-803 cells were transfected with Scrambled Control siRNA or ZEB1 siRNA, then exposed to 1mM HU for 2 h. The expression of ZEB1, p-Chk1and total Chk1 was detected by Western Blotting. (C) HCT-116 cells were transiently transfected with pcDNA3.1/ZEB1-Flag plasmid or pcDNA3.1 empty control, then exposed to 1mM HU for 2 h. The expression of ZEB1, p-Chk1 and total Chk1 was detected by Western Blotting. (D) PANC-1 and MGC-803 cells were transfected with Scrambled Control siRNA or two pairs of ZEB1 siRNA, the expression of TopBP1 and Claspin was determined by Western Blotting. (E) HCT-116 cells were transiently transfected with pcDNA3.1/ZEB1-Flag plasmid or pcDNA3.1 empty control, the expression of TopBP1 and Claspin was determined by Western Blotting. (F) MGC-803 cells were transfected with Scrambled Control siRNA, ZEB1 siRNA, TopBP1 siRNA or combined ZEB1 siRNA and TopBP1 siRNA. The expression of ZEB1, TopBP1, p-Chk1and total Chk1 was determined by Western Blotting. (G) PANC-1 and MGC-803 cells were transfected with Scrambled Control siRNA or ZEB1 siRNA, then exposed to 5 μM VE-821 for 24 h. The expression of p-Chk1 and total Chk1 was determined by Western Blotting. (H) MGC-803 cells were transfected with Scrambled Control siRNA or ZEB1 siRNA, then the proportion of cell cycle phase was examined by flow cytometric assay. *p <0.05 vs. scrambled control.
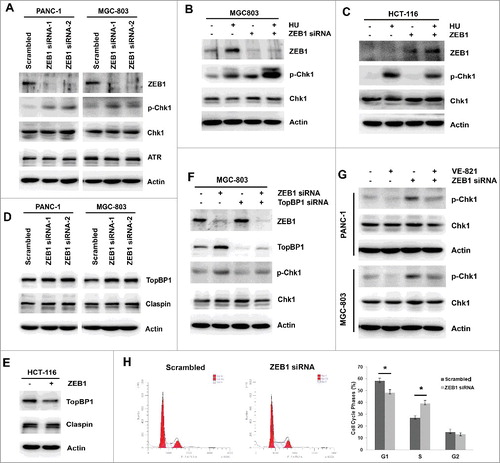
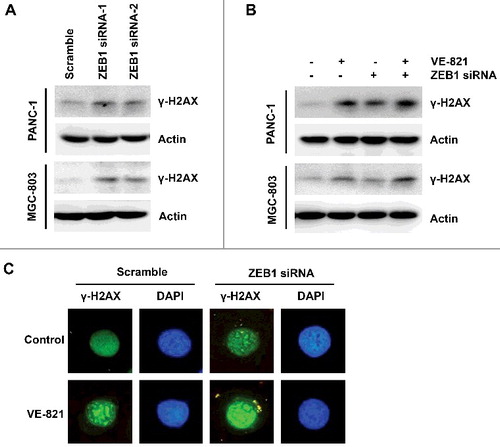
Figure 5. ZEB1 inhibition enhanced DNA damage to VE-821. (A) PANC-1 and MGC-803 cells were transfected with Scrambled Control siRNA or two pairs of ZEB1 siRNA, the expression of γ-H2AX was determined by Western Blotting. (B) PANC-1 and MGC-803 cells were transfected with Scrambled Control siRNA or ZEB1 siRNA, then exposed to 5 μM VE-821 for 24 h. The expression of γ-H2AX was determined by Western Blotting. (C) MGC-803 cells were transfected with Scrambled Control siRNA or ZEB1 siRNA, then exposed to 5 μM VE-821 for 24 h. Positive foci of γ-H2AX was performed by immunofluorescence assay.