Figures & data
Figure 1. VDR siRNA knockdown in HTR-8/SVneo trophoblast cell line. A: Reduction of VDR mRNA expression after siRNA transfection at 48 hours. B: Representative immunoblot of VDR protein and GAPDH as loading control at 47kDa and 37kDa respectively. C: Protein quantitation of VDR expression at 48 hours. The graphs depict results from n≥3 independent experiments. Data presented as mean ± SEM. **p<0.01, ***p<0.001, One way ANOVA with Bonferroni's post-test.
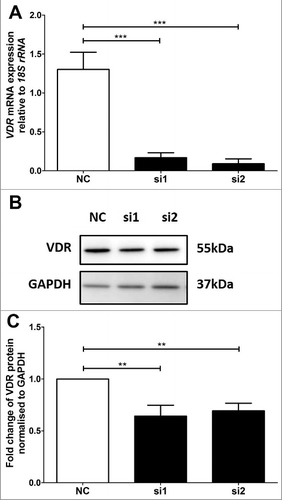
Figure 2. Functional analysis following VDR siRNA transfection. A time-dependent significant alteration in proliferation of HTR-8/SVneo (A) and in BeWo cells (B) as determined by absorbance from CyQuant assay. Significant increase of HTR-8/SVneo cell proliferation was observed at 4 and 8h time points and thereafter from 24h time-point a significant decrease in proliferation was observed. In BeWo cells a significant increase in proliferation was observed at 24h. Data of n = 3 independent experiments performed at least in triplicate or quadruplicate are presented as mean ± SEM. ***p ≤ 0.001, ****p ≤ 0.0001. one-way ANOVA.
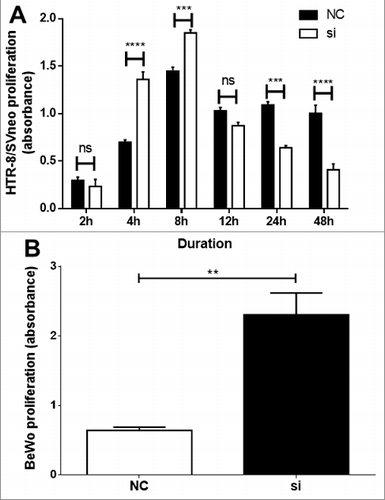
Table 1. Panel of cell-cycle genes examined in cDNA array and their associated fold-changes in expression. Genes in bold were those that showed consistent changes in pooled samples from human FGR placentae and the VDR siRNA transfected BeWo and HTR-8/SVneo trophoblast cell lines relative to their respective controls. 18S rRNA served as the housekeeping gene for all samples.
Figure 3. Relative expression of candidate downstream target cell-cycle genes of VDR. Identified cell-cycle genes demonstrated consistent gene expression changes in pooled samples of VDR siRNA transfected BeWo and HTR-8/SVneo trophoblast cells (n = 3 independent experiments performed at least in triplicate wells for treatment groups) and FGR placentae (n = 25) compared with gestation-matched control placentae (n = 25). CDKN2A: cyclin-dependent kinase inhibitor 2A; CDKN2D: cyclin-dependent kinase inhibitor 2D; HDAC4: histone deacetylase 4; HDAC6: histone deacetylase 6; TGFB2: transforming growth factor beta 2; TGFB3: transforming growth factor beta 3. Data presented from pooled samples, therefore no error bars provided.
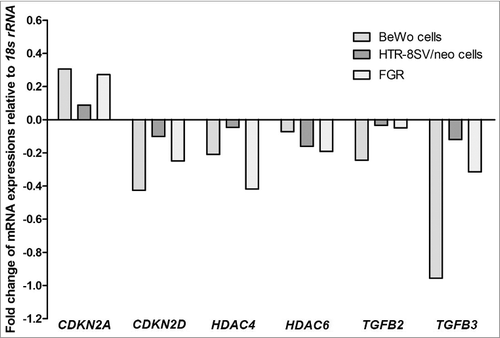
Figure 4. Validation of reduced TGFB3 mRNA and TGFβ3 protein expression in BeWo trophoblast cells. A: Reduction of TGFB3 mRNA expression following 48h VDR siRNA transfection, where ‘NC’ refers to non-targeted siRNA control and ‘si’ refers to VDR siRNA treated cells. B: Representative immunoblot of TGFβ3 protein and GAPDH as loading control at 47kDa and 37kDa respectively. C: Protein quantitation of TGFβ3 expression. The graphs depict results from n≥3 independent experiments. Data presented as mean ± SEM. *p < 0.05, ***p<0.001, Student's t test.
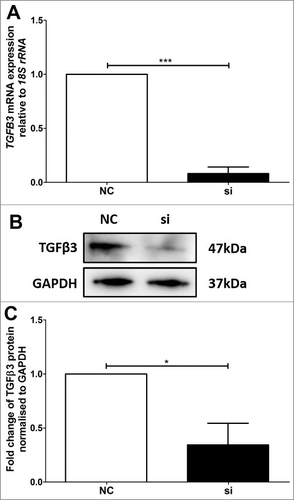
Figure 5. Validation of reduced TGFB3 mRNA and TGFβ3 protein expression in HTR-8/SVneo trophoblast cells. A: Reduction of TGFB3 mRNA expression after siRNA transfection, where ‘NC’ refers to non-targeted siRNA control and ‘si’ refers to VDR siRNA2 treated cells. B: Representative immunoblot of TGFβ3 protein and GAPDH as loading control at 47kDa and 37kDa respectively. C: Protein quantitation of TGFβ3 expression. The graphs depict results from n≥3 independent experiments. Data presented as mean ± SEM. *p < 0.05, ***p<0.001, Student's t test.
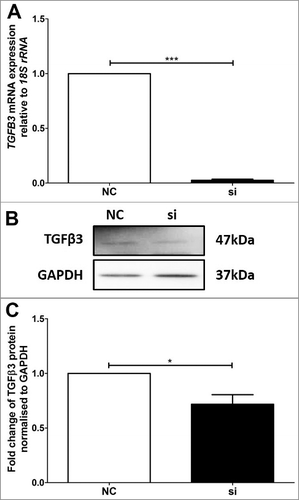
Figure 6. Validation of reduced TGFB3 mRNA and TGFβ3 protein expression in third trimester control and FGR placentae. A: TGFB3 mRNA expression was reduced in FGR placentae (n = 25) compared with control placentae (n = 25). B: Representative immunoblot of TGFβ3 protein and GAPDH as loading control at 47kDa and 37kDa respectively. C: Protein quantitation of TGFβ3 expression was performed in a subset of n = 8 control and n = 7 FGR placentae. Data presented as mean ± SEM.*p < 0.05, ***p<0.001, Student's t test.
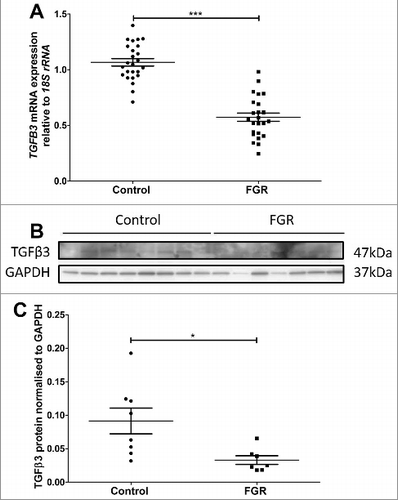
Figure 7. The functions and the mechanism of vitamin D receptor. 25-hydroxyvitamin D [25(OH)D] is the major circulating form of vitamin D that is used by clinicians to determine vitamin D status. This form of vitamin D is biologically inactive and is bound to the vitamin D–binding protein (VDBP), which transports it in the circulation to target organs, tissues and cells. 25(OH)D is converted by CYP27B1 to the biologically active form, 1,25-dihydroxyvitamin D [1,25(OH)2D] in targeted cells. Through intrinsic synthesis of 1,25(OH)2D3 and uptake of 1,25(OH)2D3 from the extracellular environment, vitamin D receptor (VDR) is activated and heterodimerizes with retinoid X receptor (RXR). This VDR/RXR complex is translocated into the nucleus and binds to the vitamin D response element (VDRE) in the promoter region to either induce or suppress transcription of a variety of genes. To control VDR activity a series of negative feedback loops exists; activated VDR both induce expression of the 1,25(OH)2D degrading enzyme CYP24A1 and down-regulates expression of the 1,25(OH)2D synthesizing enzyme CYP27B1. Decreased VDR expression results in significant changes in downstream cell cycle regulatory genes including up-regulated CDKN2A and down regulated CDKN2D, HDAC4, HDAC6, TGFB2 and TGFB3. The downstream genes of VDR were differentially expressed, suggesting their involvement in trophoblast function (proliferation, differentiation, migration and invasion), and contributing to placental insufficiency in fetal growth restriction (FGR).
![Figure 7. The functions and the mechanism of vitamin D receptor. 25-hydroxyvitamin D [25(OH)D] is the major circulating form of vitamin D that is used by clinicians to determine vitamin D status. This form of vitamin D is biologically inactive and is bound to the vitamin D–binding protein (VDBP), which transports it in the circulation to target organs, tissues and cells. 25(OH)D is converted by CYP27B1 to the biologically active form, 1,25-dihydroxyvitamin D [1,25(OH)2D] in targeted cells. Through intrinsic synthesis of 1,25(OH)2D3 and uptake of 1,25(OH)2D3 from the extracellular environment, vitamin D receptor (VDR) is activated and heterodimerizes with retinoid X receptor (RXR). This VDR/RXR complex is translocated into the nucleus and binds to the vitamin D response element (VDRE) in the promoter region to either induce or suppress transcription of a variety of genes. To control VDR activity a series of negative feedback loops exists; activated VDR both induce expression of the 1,25(OH)2D degrading enzyme CYP24A1 and down-regulates expression of the 1,25(OH)2D synthesizing enzyme CYP27B1. Decreased VDR expression results in significant changes in downstream cell cycle regulatory genes including up-regulated CDKN2A and down regulated CDKN2D, HDAC4, HDAC6, TGFB2 and TGFB3. The downstream genes of VDR were differentially expressed, suggesting their involvement in trophoblast function (proliferation, differentiation, migration and invasion), and contributing to placental insufficiency in fetal growth restriction (FGR).](/cms/asset/2ffb9402-c215-43c6-8ba4-56b00e55cdc0/kccy_a_1405193_f0007_oc.jpg)
