
Figures & data
Figure 1. SCH 900776 enhances the cytotoxicity of MLN4924 on pancreatic cancer cells. A and B, MLN 4924 and SCH 900776 on the clonogenicity of pancreatic cancer cells. 300 cells were seeded in triplicate in 6-well plates and treated with various concentrations of MLN4924 (A) and SCH 900776 (B) respectively for 10 days, and colonies with more than 50 cells were counted. Left, representative images of the results; right, relative colony numbers compared with the control (mean ± SD). C, MLN 4924 and SCH 900776 on the proliferation of pancreatic cancer cell. Cells were seeded into 96-well plates at 1000 cells per well and were then treated with SCH 900776 (left), MLN4924 and SCH 900776 (right) at various concentrations for 72 hours. Cell viability was assessed with MTS assay. *, P<0.05; **, P>0.05; MLN, MLN4924; SCH, SCH 900776.
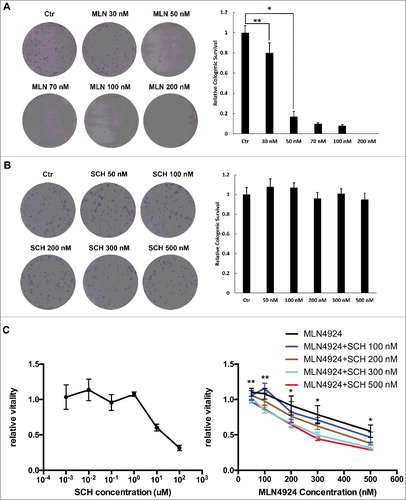
Figure 2. MLN4924 inhibits the neddylation of cullins and causes DNA damage on pancreatic cancer cells. Hup-T3 cells were treated with MLN4924 at 300 nM for indicated time periods, followed by IB with β-actin as a loading control. MLN, MLN4924.
Figure 3. MLN4924 causes double-strand breaks on pancreatic cancer cells. A and B, Hup-T3 cells were treated with MLN4924 at 300 nM for 24 hours, followed by immunofluorescence staining for 53BP1 and γ-H2AX (A), or MDC1 and BRCA1 (B). Scale bar, 50 μm.
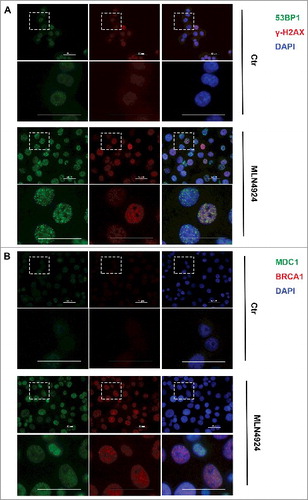
Figure 4. SCH 900776 enhances the DNA damage caused by MLN4924, abrogates G2/M arrest and promotes DNA re-replication. A, Cells were treated with MLN4924, SCH 900776 or the combination of MLN4924 and SCH 900776 at indicated concentrations for 24 hours, followed by IB analysis. B, synchronized Hup-T3 cells were treated with DMSO, MLN4924 or the combination of MLN4924 and SCH 900776, and collected at indicated time points, followed by FACS analysis for cell cycle profiling. C, asynchronized cells were treated with DMSO, MLN4924, SCH 900776 or the combination of MLN4924 and SCH 900776 for 24 hours, followed by FACS analysis. *, P<0.05; **, P>0.05; MLN, MLN4924; SCH, SCH 900776; DMSO, dimethyl sulfoxide; PI, propidium iodide. >4N represents cells having greater than tetraploid DNA content.
Figure 5. SCH 900776 increased the efficacy of MLN4924 in Panc-1 in vivo xenograft tumor model. 1 × 10⁶ Panc-1 cells were inoculated subcutaneously in the left flank of nude mice. When the tumor size reached 100 mm3, the mice were randomized into the following 4 groups (10 animals/group) and treated with (1) 20% HPBCD, (2) MLN4924 (30 mg/kg, s.c.), (3) SCH 900776 (8 mg/kg, i.p.), (4) MLN4924 combined with SCH 900776 at the preceding dosage, on a five days on and two days off schedule for two weeks. The tumor growth curve was plotted (A) and at the end of the study, tumors were resected (B) and weighed (C). *, P<0.05; **, P>0.05.
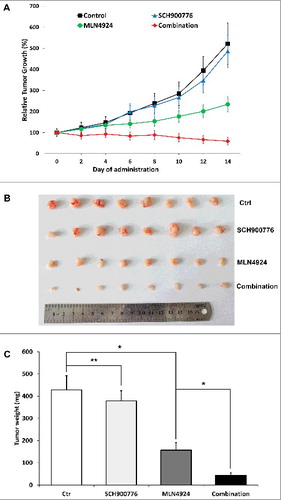
Table 1. Clinicopathological features of 90 pancreatic cancer patients.
Figure 6. NEDD8-activating enzyme levels of pancreatic cancer were irrelevant with prognosis. A, representative staining of normal pancreas tissue and pancreatic cancer tissue of different NAE-expression levels. B, the survival curves of patients with pancreatic cancer of low or medium NAE expression and of high NAE expression. NAE, NEDD8-activating enzyme.
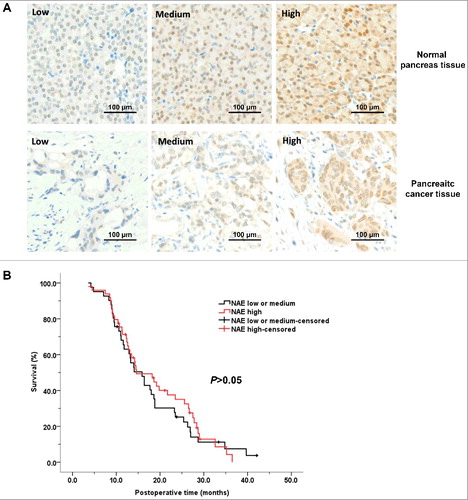
Table 2. The NAE expression levels of normal pancreas tissue and pancreatic cancer tissue of 90 patients.