Figures & data
Figure 1. T. thermophila Dpl2 is a transcription factor that regulates meiosis. (A) Microarray and transcriptome sequencing analysis of DPL2 expression. G, vegetative growth; S, starvation; numbers 0–18, number of hours post mixing. (B) Localization of Dpl2-HA (green) throughout the T. thermophila cell cycle. Scale bar: 10 μm. (C) DAPI staining shows the progress of meiosis in WT and dpl2Δ cells. The time post mixing is indicated. Scale bar: 10 μm. (D) GO enrichment analysis of downregulated DEGs in dpl2Δ cells at 3–7 h post mixing. GO terms at each time point post mixing include DNA replication and DNA repair.
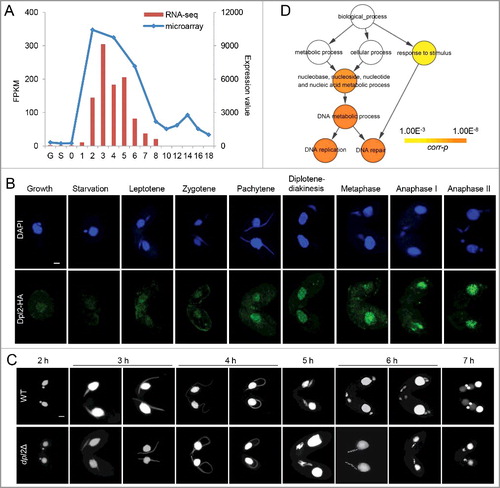
Figure 2. Dpl2 and E2fl1 form a transcription factor complex in T. thermophila. (A) Western blotting analysis of polyclonal anti-Dpl2 (left) or anti-E2fl1 (right) and anti-HA antibody to measure Dpl2 or E2fl1 protein levels during starvation and meiosis. C4, at 4 h post mixing. (B) Immunofluorescence analysis of temporal and spatial expression of endogenous and HA-tagged Dpl2 and E2fl1 protein. Scale bar: 10 μm. (C) Silver-stained Dpl2-HA and E2fl1-HA IP products. Red arrows indicate Dpl2 protein; blue arrows indicate E2fl1 protein. Western blotting analysis using anti-HA monoclonal antibody and anti-E2fl1 and anti-Dpl2 polyclonal antibodies. (D) Venn diagram of IP MS data of E2fl1-HA and Dpl2-HA.
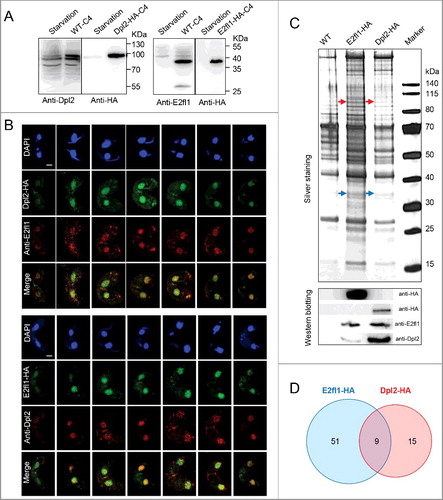
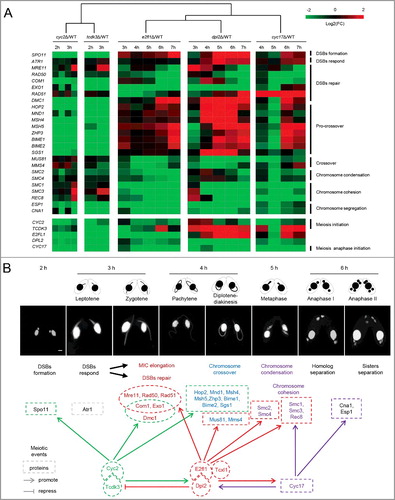
Figure 3. The E2fl1/Dpl2 complex regulates meiosis in T. thermophila. (A) Heatmap representation of fold changes in the expression of meiotic genes in cyc2Δ, tcdk3Δ, e2fl1Δ, dpl2Δ and cyc17Δ cells compared with WT cells. Upregulated or downregulated genes in mutant cells are colored in red and green, respectively. Values for cyc2Δ, tcdk3Δ and cyc17Δ expression levels were retrieved from NCBI (accession numbers GSE79286, GSE80977, GSE77585, respectively). Euclidean distance was used for hierarchical clustering analysis. The analysis was based on the time to phenotype appearance in knockout cells. (B) Construction of a meiotic regulatory network in T. thermophila. Tcxl1 may form a complex with E2fl1. There is a functional relationship between cell cycle regulators (Cyc2, Tcdk3, E2fl1, Dpl2, and Cyc17) and meiotic proteins.