Figures & data
Table 1. Summary of the sequence assembly after Illumina sequencing.
Figure 1. Count of differentially expressed genes between non-PCOS arrested and non-arrested 2-cell embryos (a), PCOS arrested and non-arrested 2-cell embryos (b) and between non-PCOS and PCOS arrested embryos (c). The x-axis shows the fold-change in gene expression, and the y-axis shows significant statistical differences. Red, up-regulated genes; green, down-regulated genes.
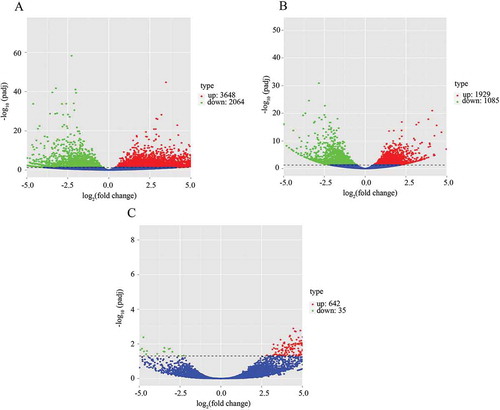
Figure 2. Cluster analysis of DEGs. A, hierarchical cluster analysis of DEGs of PCOS, non-PCOS arrested and non-arrested 2-cell embryos; B, Venn diagram showing the overlaps between groups. Red, high gene expression levels; blue, low gene expression levels.
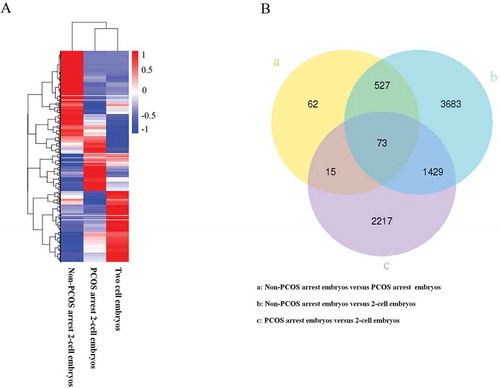
Table 2. Functional annotation of DEGs in the down-regulated genes between PCOS arrested and 2-cell embryo.
Table 3. Functional annotation of DEGs in the up-regulated genes between PCOS and non-PCOS arrested embryo.
Figure 3. GO enrichment in biological process analysis of DEGs. The x-axis shows −log10 (pvalue), and the y-axis shows the five representative GO terms in biological process. A, down-regulated genes between non-PCOS arrested and non-arrested 2-cell embryos; B, up-regulated genes between non-PCOS arrested and non-arrested 2-cell embryos; C, down-regulated genes between non-PCOS and PCOS arrested embryos; D, up-regulated genes between non-PCOS and PCOS arrested embryos; E, down-regulated genes between PCOS arrested and non-arrested 2-cell embryos; F, up-regulated genes between PCOS arrested and non-arrested 2-cell embryos.
Figure 4. KEGG enrichment analyses of DEGs. The ratio of the number of DEGs to the total gene number is represented by the enrichment factor. Size of dots: gene number; colour of dots: range of P-values. A, representative terms between non-PCOS arrested and non-arrested 2-cell embryos in down-regulated genes; B, representative terms between non-PCOS arrested and non-arrested 2-cell embryos in up-regulated genes; C, representative terms between non-PCOS and PCOS arrested embryos in down-regulated genes; D, representative terms between non-PCOS and PCOS arrested embryos in up-regulated genes; E, representative terms between PCOS arrested and non-arrested 2-cell embryos in down-regulated genes; F, representative terms between PCOS arrested and non-arrested 2-cell embryos in up-regulated genes.
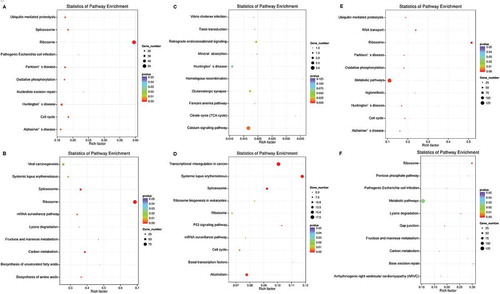
Figure 5. Representative cell cycle pathway between PCOS arrested and non-arrested 2-cell embryos. Red, down-regulated gene names.
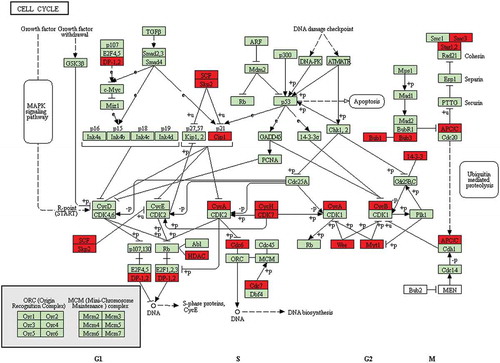
Figure 6. Relative expression of 5 selected genes by Q-PCR. The relative gene expression levels were calculating using the 2−ΔΔCt method. R.Q., relative expression; *P < 0.05 indicates that the genes were significantly down-regulated in PCOS and non-PCOS arrested embryos relative to the non-arrested 2-cell embryo.