Figures & data
Figure 1. BMI-1 is upregulated in GBM cells. (A-B)The mRNA (A) and protein (B) levels of BMI-1, EZH2 and RING1B in GBM cell lines, primary cultured tumor progenitor cells (TPC) versus normal brain tissues (control) and in U87MG sphere cells versus parental adherent cells. Results in figure A are mean ± SD (n = 3; **p < 0.01)
Figure 2. PTC-209 inhibits glioblastoma cell proliferation and results in cell cycle arrest. (A) Chemical structure of PTC-209. (B) Western blot analysis of U87MG cell lysates following PTC-209 (1 μM and 10 μM) or vehicle control (DMSO) treatment for 4 days. (C) Cell proliferation assay results for PTC-209 (1 μM and 10 μM) or DMSO treated U87MG and T98G cells (mean ± SD; n = 6; ***p < 0.001). (D) U87MG and T98G cells treated with PTC-209 (1 μM and 10 μM) or DMSO for 4 days were analyzed by flow cytometry-based propidium iodide staining. Graphs represent the mean of 3 independent experiments
Figure 3. PTC-209 inhibits glioblastoma cell migration. (A) Scratch wound healing assay was performed using U87MG cells treated with PTC-209 (1 μM and 10 μM) or DMSO. Pictures of scratch wound closure were captured at the indicated time points. Edges of scratches were highlighted manually afterwards only to illustrate cell migration. Pictures are representatives of three independent experiments. Scale bar 500 μm. (B) Unmodified pictures were analyzed by ImageJ and percentage change of wound area (i.e. wound closure) after the incubation time was calculated for 3 independent wells in parallel. PTC-209 treatment reduced the expression of genes involved in EMT. (C-D) U87MG (C) and T98G cells (D) treated with PTC-209 (1 μM and 10 μM) or DMSO for 4 days were analyzed by RT-qPCR for the mesenchymal genes (mean ± SD, n = 3; *p < 0.05; **p < 0.01; ***p < 0.001)
Figure 4. PTC-209 inhibits the self-renewal of glioblastoma stem cells (GSCs) in vitro. (A) After treatment of with PTC-209 (1 μM and 10 μM) or DMSO for 4 days, U87MG and T98G cells were respectively incubated with Hoechst 33,342 dye and side population (SP) was determined by FACS. (B) Percentage of SP cells in U87MG and T98G adherent cells in designated groups (mean ± SD; n = 3; **p < 0.01; ***p < 0.001). (C) Following treatment with PTC-209 (1 μM and 10 μM) or DMSO for 4 days, T98G cells were stained with CD133 antibody and subjected to FACS analysis. (D) Percentage of CD133+ cells in T98G adherent cells (mean ± SD; n = 3; ***p < 0.001). (E-F) Extreme limiting dilution analysis was used to measure self-renewal capability of GICs derived from parental adhesive cells under indicated condition. The frequency of sphere-initiating cells and the log fraction nonresponding calculated by webtool at http://bioinf.wehi.edu.au/software/elda/with 95% confidence interval were shown in figure E and F, respectively. The data value with zero negative response at dose 100 is represented by a down-pointing triangle in figure F. (G) Microscopic observation of T98G sphere colonies after 2 weeks under treatment with DMSO, 1 μM PTC-209, 10 μM PTC-209 or 200 μM TMZ. Images are represented for 60 independent wells. Scale bar 100 μm
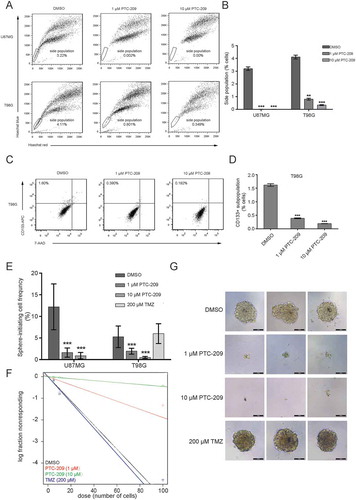
Figure 5. PTC-209 reverses BMI-1-induced changes of transcriptional program underlying GBM development. (A) In silico analysis of BMI-1 negatively correlated genes (Pearson correlation coefficient < -0.3) in glioblastoma based on TCGA datasets. The heatmap of relative expression of BMI-1 negatively correlated genes sorted by the level of BMI-1 expression (left) and bubble plots showing GO enrichment of BMI-1 negatively correlated genes in GBMs (right) were based on the TCGA datasets. (B) Volcano plots of genes in U87MG cells treated with 1 µM PTC-209 for 4 days compared with DMSO treated controls. The red plots represent the upregulated genes (up, p-value < 0.05, log2 fold change > 1), the green plots represent the downregulated genes (down, p-value < 0.05, log2 fold change < -1), and the gray plots represent the insignicantly deregulated genes (not sig). (C) qRT-PCR analysis for the validation of up/down-regulated genes which were also BMI-1 negatively/positively correlated. Data were normalized to GAPDH and related to DMSO treated controls (mean ± SD; n = 3; *p < 0.05; **p < 0.01). (D) GO analysis for upregulated genes in RNA-seq data of U87MG cells treated with 1 µM PTC-209 for 4 days compared with DMSO treated controls. Biological processes that are also enriched in T98G cells under the same treatment as U87MG cells and the BMI-1 negatively correlated genes based on the clinical data were listed
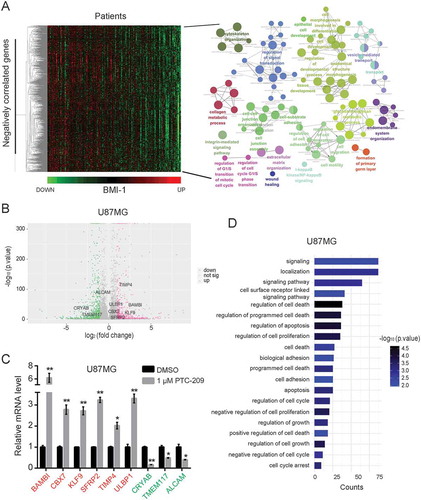
Figure 6. PTC-209 depressed the BMI-1 binding and H2AK119ub1 levels at the promoters of BMI-1 target genes. (A) Example of tracks from ChIP-seq analysis for BMI-1 at the promoters of the indicated genes in GBMs. The normalized numbers of tags (TPM) are given to the left of each graph. CpG islands are labeled with green blocks. (B-C) ChIP-qPCR analyses using anti-BMI-1 antibody. (B-C) ChIP-qPCR analyses using anti-BMI-1 antibody (B) and anti-H2AK119ub1 antibody (C) were performed on chromatin lysates prepared from U87MG treated with DMSO or 1 µM PTC-209 for 4 days. Results are expressed as the fold-enrichments relative to IgG IP controls (mean ±SD, n = 3; *p < 0.05; **p < 0.01)
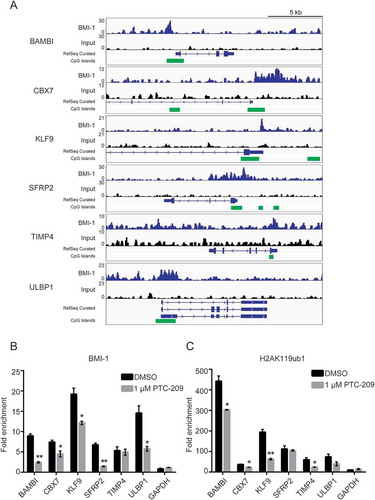
Figure 7. PTC-209 abrogates intracranial GBM progression. (A) Representative in vivo bioluminescent image of U87MG-derived intracranial tumors in the PTC-209 or DMSO treated mice brains at 1, 3 and 4 weeks after U87MG implantation. (B) The average signals of luciferase activity in PTC-209 or DMSO treated mice brains at different time points (mean ± SD; n = 8). (C) Excised tumors from the mice were subjected to IHC staining with designated antibodies (Scale bar 50 µm). (D) Survival curve of specified group of mice which were injected intracranially with 3 × 10^5 of U87 cells expressing luciferase (n = 6)
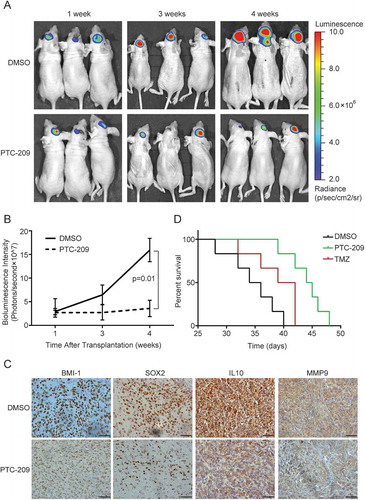
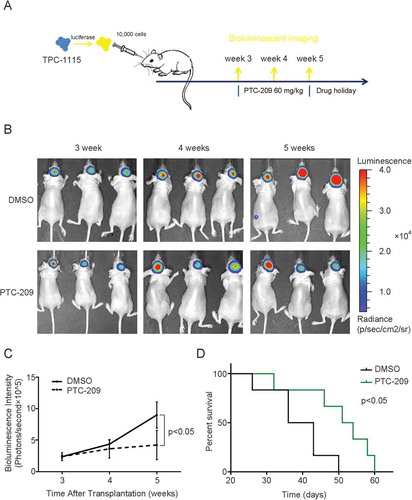
Figure 8. PTC-209 abrogates progression of TPC-1115-derived intracranial tumors