Figures & data
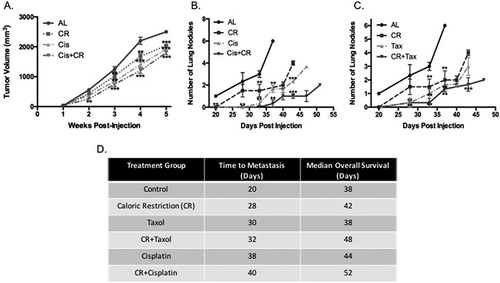
Figure 1. Caloric restriction in combination with chemotherapy decreases primary tumor growth as well as delays metastases and increases survival. Primary tumors were measured and the volume of each tumor is plotted over time according to intervention (A). CR alone reduced primary tumor growth at a reference point of 1000mm3by 32% as compared with the ad lib (AL) group, similarly the cisplatin (Cis) alone group experienced a 16% reduction in primary tumor growth. The CR combination group (Cis+CR) demonstrates an additive response with respect to primary tumor growth (64% reduction at 1000 mm3reference). *** denotes significance of p < 0.05 as compared to AL. Mice were monitored to identify lung metastases. The number of lesions visible on in vivo imaging was significantly lower in the arms receiving CR, chemotherapy alone and chemotherapy with CR as compared to AL (B and C). At 33-days post injection, the AL mice had an average of 3 lung metastases visible on imaging and the CR group had 1.5, cisplatin alone had 0.67 and Cis+CR had 0 (B; p < 0.05) docetaxol had 1.0, Tax+CR had 0.67 (p < 0.05) (C). Time to metastases was prolonged in all treatment groups, but most significantly in those groups receiving combination therapy (D). For panels B and C, ** denotes significance of p < 0.05 as compared with the AL group and *** denotes p < 0.025 as compared to the CR alone group

Figure 2. The addition of CR to chemotherapy alters metabolic signaling within the primary tumor as well as metastases. Representative images of fluorescent imaging demonstrate the differences in primary tumor growth and metastases in the chemotherapy and CR+chemotherapy groups (A). Key signaling nodes in the Akt/PI3K pathway were detected by western blot in primary tumor tissue (C). Quantification was normalized to the AL control group for PI3K and the ratio of pAkt to Akt was calculated and plotted for all groups. Mice receiving CR alone had a significant reduction in PI3K by 50% (p = 0.018), whereas the other groups had a more modest reduction, the most notable at 30% in the Cis+CR arm (p = 0.034). All treatment groups demonstrated reduction in the pAkt/Akt ratio, the effect of CR appeared to be additive as compared to either CR alone or chemotherapy alone. * denotes significance level of p < 0.05 for the PI3K and ** denotes p < 0.05 for pAkt/Akt ratio. Serum IGF-1 and its major binding protein IGF-BP3 were measured and the ratio of free IGF-1 was calculated and plotted (D). The effect of adding CR to chemotherapy was additive in terms of free IGF-1 with 52% reduction compared to AL in the Tax+CR arm and 65% reduction compared to AL in the Cis+CR arm. * denotes p < 0.05 and ** denotes p < 0.01.]
![Figure 2. The addition of CR to chemotherapy alters metabolic signaling within the primary tumor as well as metastases. Representative images of fluorescent imaging demonstrate the differences in primary tumor growth and metastases in the chemotherapy and CR+chemotherapy groups (A). Key signaling nodes in the Akt/PI3K pathway were detected by western blot in primary tumor tissue (C). Quantification was normalized to the AL control group for PI3K and the ratio of pAkt to Akt was calculated and plotted for all groups. Mice receiving CR alone had a significant reduction in PI3K by 50% (p = 0.018), whereas the other groups had a more modest reduction, the most notable at 30% in the Cis+CR arm (p = 0.034). All treatment groups demonstrated reduction in the pAkt/Akt ratio, the effect of CR appeared to be additive as compared to either CR alone or chemotherapy alone. * denotes significance level of p < 0.05 for the PI3K and ** denotes p < 0.05 for pAkt/Akt ratio. Serum IGF-1 and its major binding protein IGF-BP3 were measured and the ratio of free IGF-1 was calculated and plotted (D). The effect of adding CR to chemotherapy was additive in terms of free IGF-1 with 52% reduction compared to AL in the Tax+CR arm and 65% reduction compared to AL in the Cis+CR arm. * denotes p < 0.05 and ** denotes p < 0.01.]](/cms/asset/38760455-0c84-4976-9c69-ca7ff9a05b67/kccy_a_1471314_f0002_c.jpg)
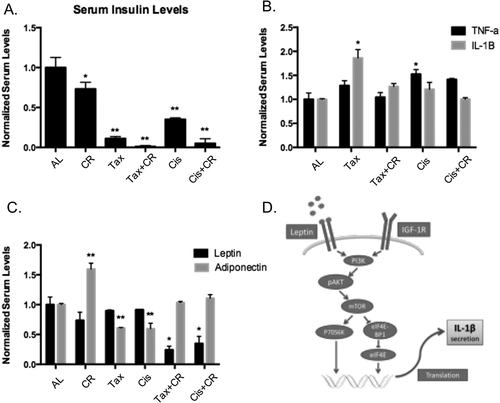
Figure 3. Chemotherapy-induced inflammation is blunted by the addition of CR. Serum insulin levels were measured across groups and normalized to the AL control, CR alone decreased this by 25%, chemotherapy alone altered serum insulin and the combination therapy again had an additive effect with 87% reduction in the Tax+CR arm (p =0.001) and 82% in the Cis+CR arm (p = 0.003) (A). * denotes p < 0.05 and ** denotes p < 0.01. Inflammatory cytokines TNF-αand IL-1βwere both measured and increased with the use of chemotherapy alone as compared to AL controls; Tax increased TNF-αby 1.6-fold (p = 0.042) and Cis increased TNF-αby 1.2-fold. The addition of CR dampened this increase to 1.2-fold in the Tax+CR arm and 1.0 (equivalent) in the Cis+CR arm (B). * denotes p < 0.05. Adipokines fluctuate with chemotherapy treatment and leptin significantly decreases in the Tax+CR and Cis+CR arms (75% reduction and 62% reduction; p = 0.021, p = 0.037) (C). While adiponectin is decreased with systemic treatment alone, this response is dampened by the addition of CR, the Tax+CR arm had equivalent levels as compared to the AL control and the Cis+CR arm had a 1.2-fold increase, though nonsignificant. * denotes p < 0.05 for leptin, ** denotes p < 0.05 for adiponectin. Proposed mechanism by which leptin can affect tumor growth and the IGF-1R pathway (D)

