Figures & data
Figure 1. VEGFR2 was overexpressed in cervical cancer and predicted poor prognosis. (a and b) As the IHC showed, positive VEGFR2 staining was detected in 19.1% normal cervix (4/21, none was VEGFR2 high expression) while in 71.5% (108/151, 58 cases were VEGFR2 high expression) cervical cancer (P < 0.001); (c and d) Overexpression of VEGFR2 was not correlated with histological differentiation (P = 0.391), but significantly indicated advanced tumor stage (P = 0.026); (e and f) There was no relationship between VEGFR2 expression and pathological subtype (P = 0.513) or with patient age (P = 0.285); (g and h) Among patients who accepted the surgery (n = 128), high level of VEGFR2 was notably associated with lympho node metastasis (P = 0.012), but not lymph vascular space invasion (P = 0.330); (i) Patients with high expression of VEGFR2 obtained a much shorter overall survival (P = 0.025)
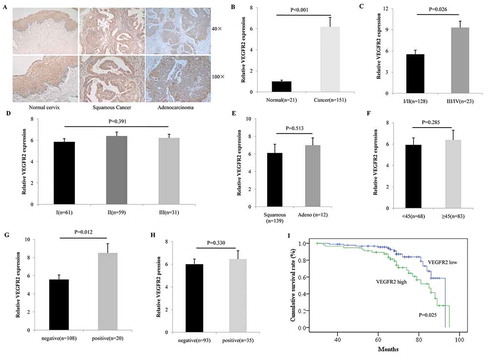
Figure 2. Apatinib suppresses cellular proliferation by arresting the cell cycle and inducing apoptosis. (a) As western blot shown, the protein expression of VEGFR2 were positive in all the four cervical cancer cell lines. SiHa and Hcc94 cells presented the highest level of phosphorylated VEGFR2, while C33A and HeLa cells contained moderate and mild level of phosphorylated VEGFR2; (b) In CCK-8 assay, SiHa and HCC94 cells were more sensitive to Apatinib than C33A and HeLa cells (IC50 = 13.9 μM, 21.8 μM, 26.6 μM, 31.2 μM, respectively); (c) Compared these to the negative control, Apatinib significantly decreased the number of colonies formed after a 2- week culture in both SiHa and Hcc94 cells (P = 0.037 and 0.023, respectively); (d and e) the 24-hour treatment of Apatinib induced significant G1-phase arrest in a dose-dependent manner in both SiHa and Hcc94 cells (P = 0.007 and 0.016, respectively)
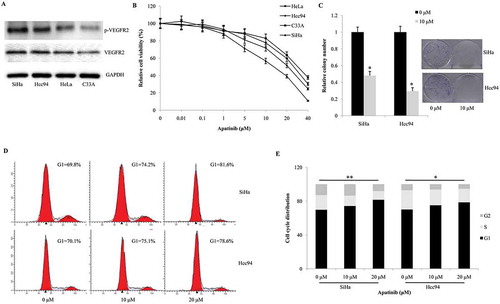
Figure 3. Apatinib promotes apoptosis and induces cellular stress in cervical cancer cells. (a and b) Apatinib directed more SiHa and Hcc94 cells toward apoptosis compared to the control group (P = 0.005 and 0.001, respectively); (c) In the two cervical cancer cells, Apatinib significantly promoted the production of ROS in a dose-dependent manner, especially in the 10 μM and 20 μM groups; (d) Compared to the control, the mitochondrial membrane potential in SiHa and Hcc94 cells were notably downregulated by the 2-hour treatment with Apatinib (P = 0.003 and 0.023, respectively)
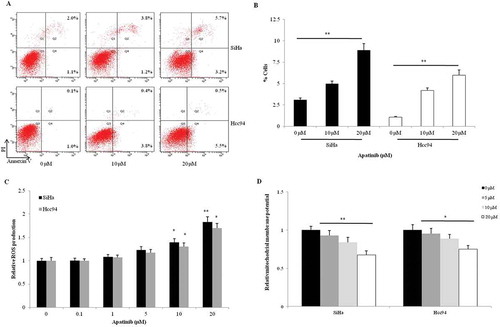
Figure 4. Apatinib affects the gene expression profiles in cervical cancer cells. (a) According with the gene expression profile in SiHa, many genes involved in cell cycle progression (CDK1, CCNC and CCND3), apoptosis (DAD1 and BAG1), and proliferation (PCNA) were significantly downregulated by the treatment of Apatinib; (b) Using KEGG analysis, we observed that p53, proteasome, TGF-beta, cell cycle, homologous recombination and mismatch repair signaling pathways were the most significantly regulated by Apatinib; (c) Gene Ontology analysis showed that the genes involved in mitotic cell cycle (both G1/S transition and G2/M transition), cell division, DNA repair, and cell proliferation were under the precise regulation of Apatinib; (d and e) Using real time PCR, we confirmed the increased mRNA levels of VEGF-A, IL-6, and the decreased expressions of CDK1, CCNC, CCND3; (f) In both SiHa and Hcc94 cells, the 24-hour treatment with Apatinib significantly inhibited the phosphorylation of VEGFR2, ERK and AKT
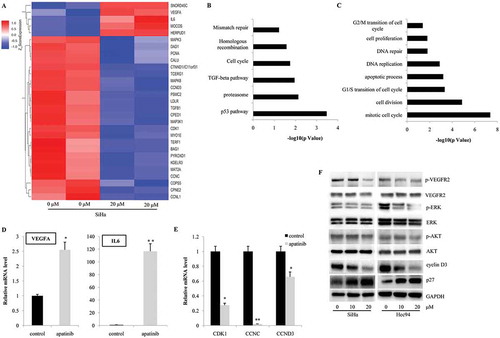
Table 1. Combination indexes (CI) of Apatinib with Paclitaxel, Cisplatin or carboplatin
Table 2. The clinico-pathological parameters of cervical cancer patients and normal control
Table 3. Primer sequences for real time PCR
Figure 5. Apatinib synergizes with Paclitaxel in cervical cancer cells. (a and b) a low dose of Apatinib (5 μM) allowed for significant synergistic effects with Paclitaxel in both SiHa and Hcc94 cells; (c-f) However, we found no synergy between Apatinib and Cisplatin or carboplatin
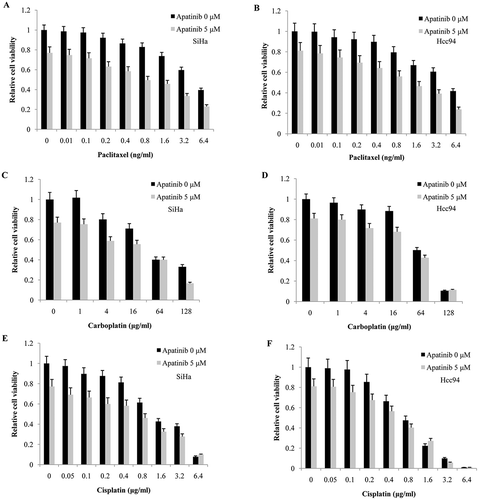
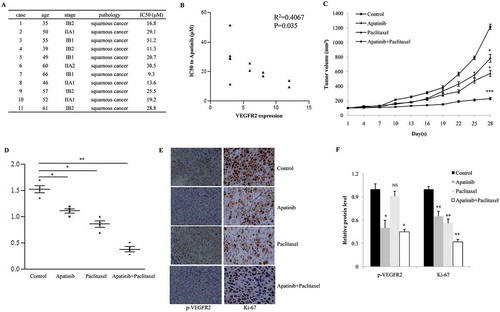
Figure 6. Apatinib suppresses the growth of SiHa xenografts in vivo. (a) As the CCK-8 assay shown, 5 of 11 primary cervical cancer tissues showed significant sensitivity to Apatinib (IC50 < 20 μM); (b) these cancer tissues with higher level of VEGFR2 were more sensitive to Apatinib (R2 = 0.4067, P = 0.035); (c) In a nude mouse model, the single use of Apatinib or Paclitaxel significantly suppressed the growth of SiHa xenografts, and the combination with the 2 drugs further augmented this effect (P = 0.043, 0.031 and <0.001, respectively); (d) Compared to the control group, tumor weights in the Apatinib group and Paclitaxel group were significant lower (P = 0.05 and 0.024, respectively), and the tumor weights in the combination group were the lowest (P = 0.007); (e and f) As IHC shown, the phosphorylation of VEGFR2 was positive in the control group and Paclitaxel group (P = 0.033 and 0.019, respectively), but was notably inhibited in Apatinib group and combination group. In addition, Ki-67 (a proliferative marker) was suppressed by the single treatment with Apatinib or Paclitaxel, and was further decreased in tumors treated with Apatinib plus Paclitaxel (P = 0.041, 0.029 and 0.005, respectively)