Figures & data
Figure 1. The establishment of psychological stress mouse model. A) Chronic restraint stress decreased body weight gain (n = 6). B) and C) There was no difference in average daily food or water intake per mouse between control and stress groups (n = 6). D) Chronic restraint stress significantly increased serum corticosterone in stress mice compared with control mice every week during the period of stress (n = 6). Data are presented as the mean ± SEM. **P < 0.01 vs. control. ***P < 0.001 vs. control. Control: control group; Stress: CRS group
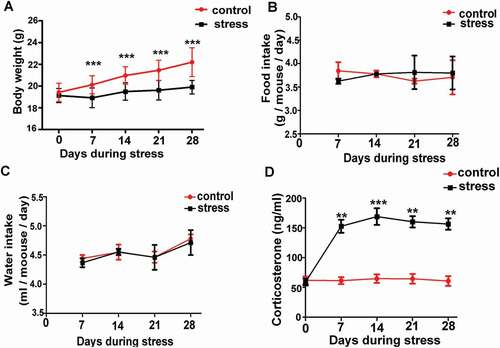
Figure 2. Chronic stress increased the percentage of abnormal bipolar spindles. A) A typical barrel-shaped spindle apparatus was formed in oocytes from control group mice. B) and C) Oocytes from CRS group exhibited an asymmetric spindle with one pole wider than the other pole. D) The percentage of abnormal bipolar spindles was significantly higher in oocytes from CRS group than control group (n = 54). Data are presented as the mean ± SEM. **P < 0.01 vs. control. Control: control group; Stress: CRS group
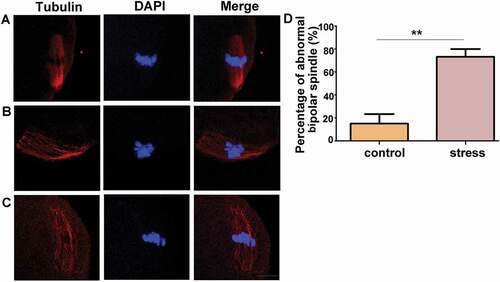
Figure 3. Time-lapse microscope observation of live oocytes that underwent GVBD in each group in vitro. A) Oocytes from control group cultured in basic culture medium. B) and C) Oocytes from stress group cultured in basic culture medium. D) Oocyte from stress group cultured in basic culture medium plus MG132. E) Percentages of GVBD and non-GVBD among control, stress, and stress+MG132 groups, respectively, after 8 hours released from IBMX (n = 54). F) The average time required for oocytes from control, stress, and stress+MG132 groups, excluding GV-arrested oocytes for 8 h (n = 54). G) The percentage of GVBD varied from time to time in oocytes among control, stress, and stress+MG132 groups (n = 54). Arrows indicate germinal vesicle in oocytes. Data are presented as the mean ± SEM. Bar = 25 µm. *P < 0.05 vs. control group; **P < 0.01 vs. control group; ▲P < 0.05 vs. stress group; ▲▲P < 0.01 vs. stress group. Control: oocytes from control mice cultured in basic culture medium; stress: oocytes from CRS mice cultured in basic culture medium; stress+MG132: oocytes from CRS group cultured in basic culture medium plus MG132. (GVBD, germinal vesicle breakdown)
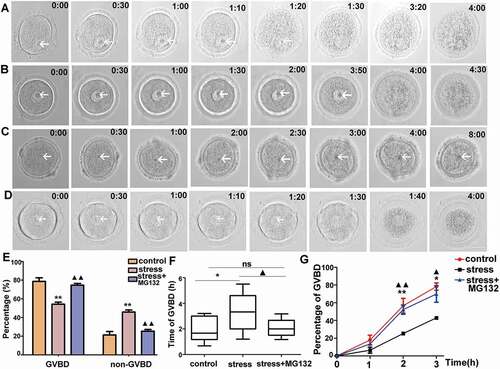
Figure 4. Psychological stress increased the percentage of NSN-type oocytes. A) There was no difference in oocyte diameter between control and CRS groups (n = 50). B) NSN-type and SN-type oocytes are shown (Bar = 25 µm). C) The percentage of NSN-type oocytes increased in CRS group (n = 80). D) The percentage of SN-type and NSN-type oocytes among different groups after three-hour culture in vitro (n = 80). E) After three-hour culture, the percentage of SN-type oocytes increased in control group, whereas there was no difference in CRS group mouse oocytes (n = 80). Data are presented as the mean ± SEM. * P < 0.01, **P < 0.01, ns: non-significant difference
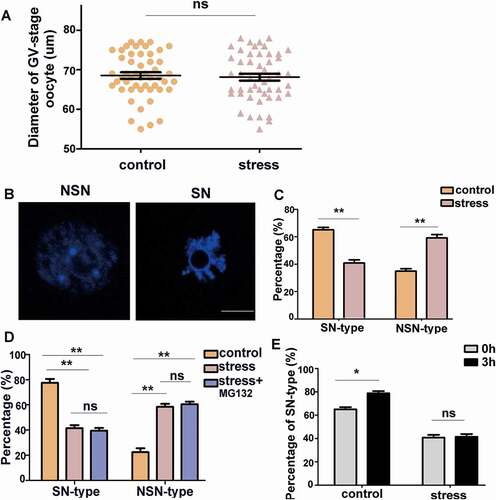
Figure 5. Psychological stress decreased the protein levels of CCNB1 and securin. A) CCNB1 expression in control mouse oocytes. B) CCNB1 expression in stress mouse oocytes. C) Securin distribution in oocytes from control group. D) Securin distribution in oocytes from CRS group. E) The average fluorescence intensity of CCNB1 significantly decreased in CRS mouse oocytes (n = 54). F) The fluorescence intensity of securin in oocytes from CRS group mice significantly decreased compared with control group mice (n = 54). G) and H) CCNB1 protein level decreased in CRS group (150 oocytes per lane, n = 3). I) and J) Securin protein level significantly decreased in oocytes from CRS group (50 oocytes per lane, n = 3). Data are presented as the mean ± SEM. Bar = 25 µm. ***P < 0.001. CCNB1: cyclin B1
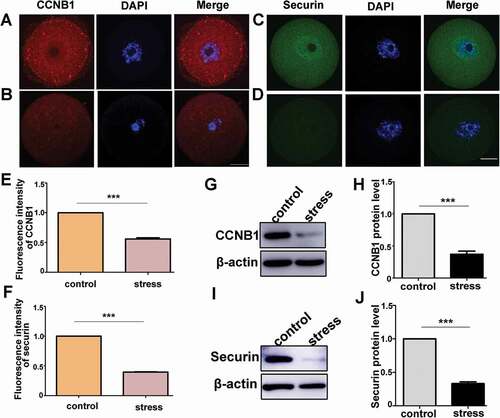
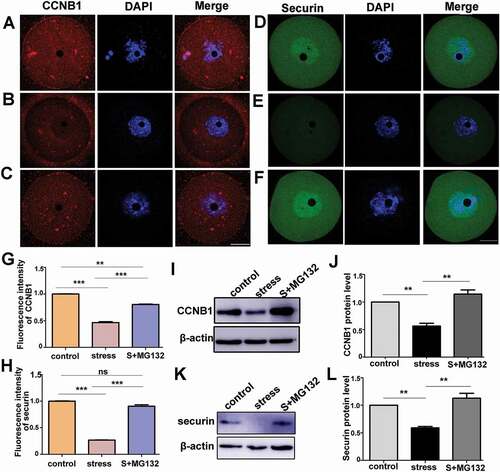
Figure 6. APC/C inhibitor, MG132, rescued the decreases in the protein levels of CCNB1 and securin in CRS mouse oocytes. A) and D) Immunostaining of CCNB1 and securin in control oocytes cultured in basic culture medium for three hours. B) and E) Immunostaining of CCNB1 and securin in stress oocytes cultured in basic culture medium. C) and F) Immunostaining of CCNB1 and securin in stress group oocytes cultured in basic culture medium + MG132. G) and H) The fluorescence intensity of CCNB1 or securin among three groups was statistically analyzed; MG132 increased the proteins level of CCNB1 and securin in oocytes from CRS group mice (n = 54). I) and J) The protein level of CCNB1 in different groups was analyzed by Western blot; MG132 significantly increased the protein level of CCNB1 in oocytes from CRS group mice (150 oocytes per lane, n = 3). K) and L) Western blotting showing the reduced expression of securin was rescued by MG132 in CRS group mouse oocytes (50 oocytes per lane, n = 3). Data are presented as the mean ± SEM. Bar = 25 µm. **P < 0.01, ***P < 0.001. Control: control group oocytes cultured in basic culture medium; Stress: CRS group oocytes cultured in basic culture medium; S+MG132: CRS group oocytes cultured in basic culture medium + MG132