Figures & data
Table 1. Association between patients, characteristics, and ZEB1-AS1 expression in 65 CRC cases
Figure 1. Abnormal ZEB1-AS1 expression is associated with CRC. (a) Expression of ZEB1-AS1 in 65 CRC tissue samples. The expression of ZEB1-AS1 was significantly elevated in the CRC tissues compared with that in the adjacent non-tumor tissues. Statistical differences were analyzed using the Wilcoxon signed-rank test (*P < 0.01). (b) RT-qPCR analysis was used to examine ZEB1-AS1 expression levels in various CRC cell lines (RKO, Caco2, DLD1, HCT116, LOVO and SW480) and the HEK293T cell line (mean ± SD, n = 6; *P < 0.05 vs 293T)
Figure 2. ZEB1-AS1 knockdown inhibits CRC cell proliferation. (a) Knockdown efficiencies in LOVO cells and SW480 cells transfected with si-ZEB1-AS1 (si#1 and #2; mean ± SD, n = 6; *P < 0.05 vs NC). (b) Knockdown of ZEB1-AS1 impaired proliferation in LOVO and SW480 cells, as revealed by CellTiter 96® AQueous One Solution Cell Proliferation assay (n = 6; *P < 0.05 vs NC). (c) Histological analysis of the rates of colony formation in control (NC) and ZEB1-AS1 knockdown groups (si#1 and si#2; n = 6; *P < 0.05 vs NC). (d) The EdU incorporation assay was used to examine the effects of ZEB1-AS1 inhibition on DNA synthesis during cell proliferation. Images were taken at × 200. The results showed that the proportion of S-phase cells (EdU-positive cells) was decreased in the siRNA-treated groups (n = 6, *P < 0.05 vs NC). (e) Flow cytometric analysis of cell cycle arrest 48 h after treatment with siRNAs (si#1 and si#2) or a negative control (NC) in LOVO and SW480 cells (n = 6, *P < 0.05 vs NC). (f-g) The expression of cell cycle-related proteins (cyclin D1, CDK4, Rb, and p-Rb) was analyzed by Western blotting in control (NC) and ZEB1-AS1-knockdown LOVO and SW480 cells (n = 6; *P < 0.05 vs NC). (A-B) Flow cytometric analysis of apoptotic rates in LOVO and SW480 cells after siRNA treatment. (C-F) Western blotting was used to investigate alterations in the levels of apoptosis-related proteins in LOVO and SW480 cells. (Mean ± SD, n = 6; *P < 0.05 vs NC)
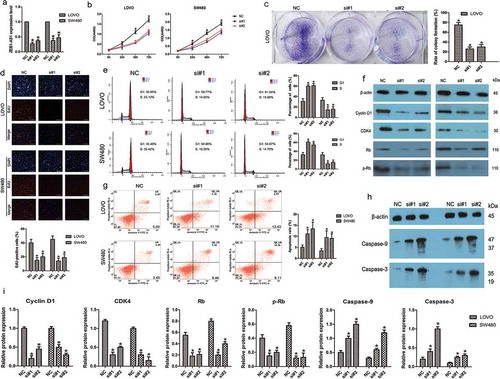
Figure 3. Upregulation of ZEB1-AS1 increases CRC cell proliferation. (a) RT–qPCR analysis of ZEB1-AS1 expression in RKO and HCT116 cells transfected with pcDNA3.1-ZEB1-AS1 or empty pcDNA3.1 vector (mean ± SD, n = 6; *P < 0.05 vs pcDNA3.1). (b) Upregulation of ZEB1-AS1 promoted proliferation in RKO and HCT116 cells, as revealed by CellTiter 96® AQueous One Solution Cell Proliferation assay (n = 6; *P < 0.05 vs pcDNA3.1). (c) Histological analysis of the rates of colony formation in pcDNA3.1 and ZEB1-AS1-overexpressing groups (n = 6; *P < 0.05 vs pcDNA3.1). (d-e) EdU incorporation assays were used to examine the effects of ZEB1-AS1 overexpression on DNA synthesis during cell growth. Images were taken at × 200. (n = 6; *P < 0.05 vs pcDNA3.1). (f-g) Western blotting showed that the proportion of S-phase cells (EdU-positive cells) was increased in pcDNA3.1-ZEB1-AS1-treated groups (n = 6, *P < 0.05 vs pcDNA3.1)
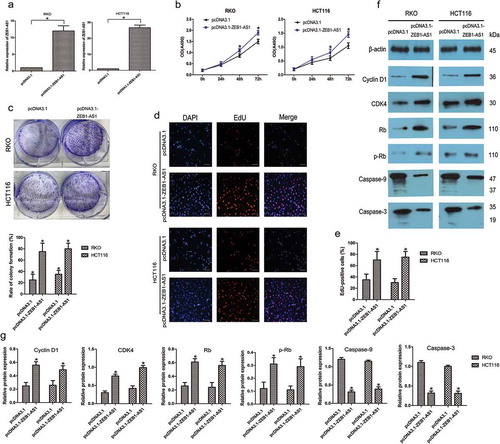
Figure 4. Negative regulation of ZEB1-AS1 by miR-181a-5p. (a) Predicted miR-181a-5p binding sites in the ZEB1-AS1 sequence. Numbers indicate nucleotide positions relative to the ZEB1-AS1 transcriptional start site. (b) miR-181a-5p mRNA levels were plotted against ZEB1-AS1 expression in 65 CRC specimens, demonstrating a significant positive correlation (two-tailed Pearson’s correlation, r = 0.706; P < 0.01). (c, d) RKO and LOVO cells were transfected with a miR-181a-5p inhibitor (c) or mimic (d), and ZEB1-AS1 expression was analyzed by RT-qPCR 48 h later (n = 6, *P < 0.05 vs NC). (e-f) RT–qPCR was used to detect ZEB1-AS1, miR-181a-5p, GAPDH and MALAT1 levels in the cytoplasmic and nuclear fractions of RKO and LOVO cells. GAPDH and MALAT1 served as a cytoplasmic and nuclear localization marker, respectively (n = 6, *P < 0.05 vs NC)
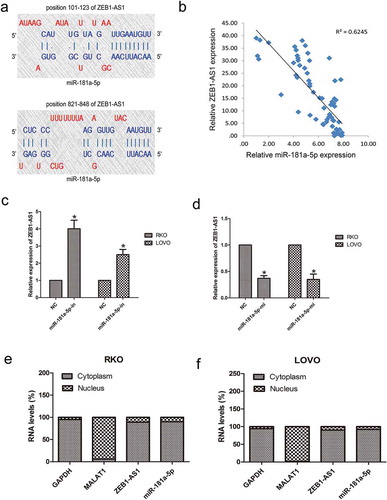
Figure 5. MiR-181a-5p inhibits ZEB1-AS1 function. (a) RKO and LOVO cells were co-transfected with a negative control or miR-181a-5p mimic and either a control plasmid (pcDNA3.1) or ZEB1-AS1 expression plasmid (pcDNA3.1-ZEB1-AS1). Cell viability was determined using CellTiter 96® AQueous One Solution Cell Proliferation assays (n = 6; *P < 0.05 vs NC+pcDNA3.1; #P < 0.05 vs NC+pcDNA3.1-ZEB1-AS1). (b-c) Colony-formation assay in CRC cells after cotransfection with a negative control or miR-181a-5p mimic and a control plasmid or ZEB1-AS1 expression plasmid (n = 6; *P < 0.05 vs NC+pcDNA3.1; #P < 0.05 vs NC+pcDNA3.1-ZEB1-AS1)
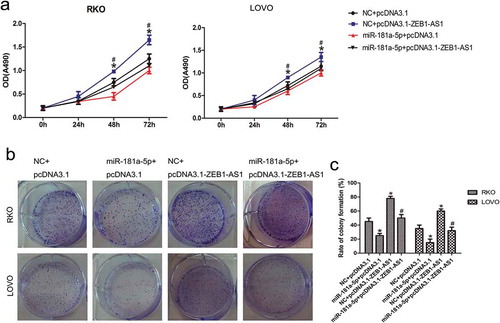
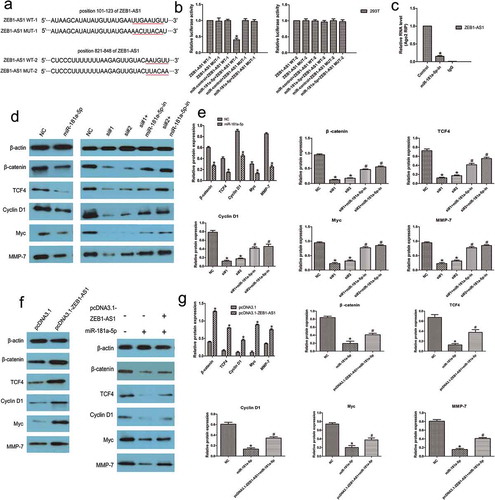
Figure 6. ZEB1-AS1 is a direct target of miR-181a-5p. (a) Schematic illustration of the predicted ZEB1-AS1/miR-181a-5p binding sites and the mutations in these binding sequences. (b) Luciferase assays in 293 T cells transfected with wild-type or mutant ZEB1-AS1 and miR-181a-5p (n = 6, *P < 0.05 vs NC). (c) The amount of ZEB1-AS1 and miR-181a-5p bound to Ago2 or IgG was measured by RT–qPCR in the presence of a miR-181a-5p inhibitor or negative control (n = 6, *P < 0.05 vs NC). (d-e) Western blotting was used to detect levels of β-catenin, TCF4, cyclin D1, Myc, and MMP-7 in LOVO cells after transfection with miR-181a-5p mimic or ZEB1-AS1-siRNAs or co-transfection with miR-181a-5p inhibitor and ZEB1-AS1-siRNAs (n = 6; *P < 0.05 vs NC; #P < 0.05 vs ZEB1-AS1-siRNAs). (f-g) Expression of miR-181a-5p targets in RKO cells transfected with a ZEB1-AS1 expression plasmid or co-transfected with a ZEB1-AS1 expression plasmid and a miR-181a-5p mimic (n = 6; *P < 0.05 vs NC; #P < 0.05 vs miR-181a-5p)