Figures & data
Table 1. Comparison of the staining intensity between benign and malignant prostate tissues
Figure 1. INTS6 protein staining patterns in prostate tissues (magnification, 400×). (a) Positive INTS6 staining in the nucleus of most benign prostate tissues. (b) Decreased INTS6 staining in a benign prostate tissue sample. (c) Positive INTS6 staining in a prostate cancer tissue sample. (d, e) Decreased staining intensity or a decreased proportion of positive nuclei in prostate cancer tissue. (f) Negative INTS6 staining in a prostate cancer tissue sample
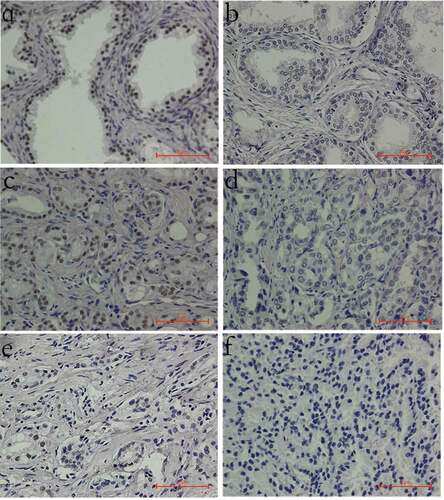
Figure 2. A small dsRNA (dsRNA-915) induces INTS6 expression in various human cells. (a) A schematic of the INTS6 promoter showing the transcription start site and the target site of dsRNA-915. (b) CRPC cells (PC3 and DU145), human prostate epithelial cells (RWPE1), human hepatocellular carcinoma cells (HepG2), and normal hepatic cells (L02) were transfected with small RNAs for 96 h at a concentration of 20 nM. INTS6 mRNA was detected by real-time quantitative PCR. GAPDH was used as an internal control. The results were standardized to those of the mock group (transfected with vector alone), and the data are presented as the mean ± SD of three independent experiments. *P < 0.05 compared with the mock group. (c) INTS6 protein was detected by western blot analysis. GAPDH served as a loading control. Increased INTS6 protein expression was observed in dsRNA-915-treated cells
Figure 3. (a) The course of INTS6 activation. PC3 and DU145 cells were transfected with 20 nM dsRNA-915, and INTS6 mRNA was detected every 24 h using real-time quantitative PCR. GAPDH served as an internal control. (b) The effects of dsRNA-915 on histone modifications at the INTS6 promoter in PC3 cells. Using antibodies against H3K4m2, H3K9m2 and H3K9ac, DNA fragments that cross-linked with the specific histone were pulled down and analyzed in ChIP assays. The co-precipitated DNA was amplified by qPCR using a primer set specific for the indicated region (−849/−1022). Input DNA was used as the internal control. The results were standardized to those of the dsControl group, and the data are presented as the mean ± SD of three independent experiments. * P < 0.05 compared with the dsControl group
Figure 4. Time- and dose-dependent inhibition of growth and viability by dsRNA-915 in different cell lines. Cell growth/viability was analyzed using the CCK8 assay. The results were standardized to the mock group, and the data are presented as the mean ± SD (n = 4). (a) Reduced cell growth/viability was observed in dsRNA-915-treated (5, 10, 20 and 50 nM) CRPC cells starting at 48 h. (b) In the benign epithelial cells (RWPE1 and L02), dsRNA-915 (20 nM) moderately inhibited cell growth and viability
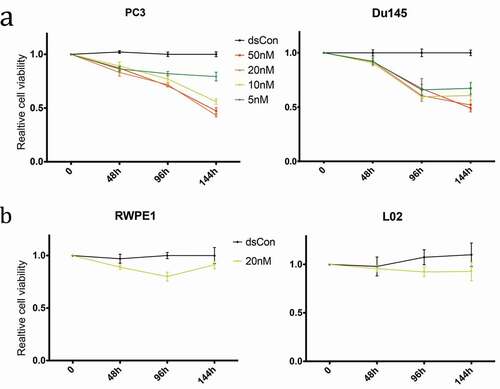
Figure 5. (a) Decreased clonogenicity of CRPC cells treated with dsRNA-915. Four hundred cells transfected with dsControl RNA or dsRNA-915 were plated in each well. Two weeks later, the colonies were fixed and stained with crystal violet. Images of the wells are shown, and the data from three independent experiments are presented as the mean ± SD on the right side. (b) Cell cycle arrest caused by dsRNA-915 in CRPC cells. Cells transfected with dsControl RNA or dsRNA-915 were subjected to flow cytometry for cell cycle analysis. Three independent experiments were performed for each group, and the mean percentage of cells in each phase of the cell cycle is presented. The data that reached significance are labeled with asterisks. (c) dsRNA-915 decreased the motility of CRPC cells. PC3 and DU145 cells were transfected with dsControl RNA or dsRNA-915 for 72 h, and cell migration and invasion were assessed by transwell assays. Representative microscopic (200×) migration and invasion images are shown in the upper section. The number of migrating and invading cells was counted, and the results of 3 independent experiments are presented as the mean ± SD in the bottom section (* P < 0.05)
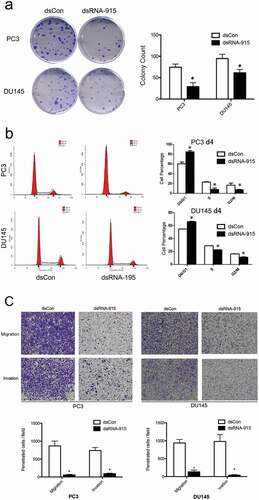
Figure 6. dsRNA-915 suppresses the Wnt signaling pathway in CRPC cells. PC3 and DU145 cells were treated with mock, dsControl RNA, or dsRNA-915 96 h prior to further analysis. (a) The mRNA levels of representative genes in the Wnt signaling pathway were detected using real-time quantitative PCR. The mRNA levels of cyclin D1, Fra1 and MET decreased after dsRNA-915 treatment, whereas those of β-catenin, c-Myc, or VEGF did not decrease. The results were standardized to those of the mock group, and the data are presented as the mean ± SD of three independent experiments. (b) The protein levels of representative genes were detected by western blot assay. Decreased expression of β-catenin, cyclin D1, Fra1 and MET was detected. (c) The immunofluorescent staining of β-catenin in PC3 and DU145 cells is presented. A significant decrease in intracellular β-catenin expression was observed (×200 magnification)
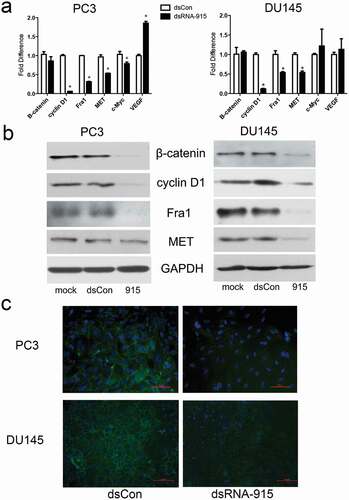
Figure 7. Knockdown of INTS6 reverses the suppressive effect of dsRNA-915 on Wnt/β-catenin signaling in PC3 cells. INTS6 gene expression was knocked down with siRNA targeting the INTS6 mRNA sequence. The ability of dsRNA-915 to suppress Wnt/β-catenin signaling in PC3 cells was assessed with or without siRNA treatment. (a) The siRNA treatment suppressed the up-regulation of INTS6 mRNA in dsRNA-915-treated cells. This siRNA treatment reversed the suppressive effect of dsRNA-915 on Wnt-targeted signals (cyclin D1, Fra1 and MET). The results were standardized to those of the dsControl group, and the data are presented as the mean ± SD of three independent real-time PCR experiments. (b) The β-catenin protein (green fluorescence) was analyzed by immunohistochemistry. The siRNA treatment enhanced β-catenin expression in PC3 cells and partially reversed the suppressive effect of dsRNA-915 on β-catenin protein levels
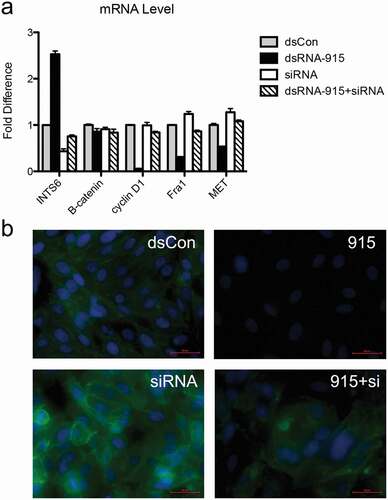
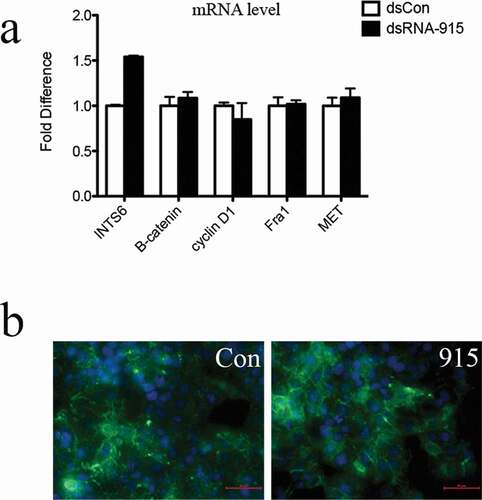
Figure 8. Upregulation of INTS6 gene by dsRNA-915 does not inhibit Wnt signaling in HepG2 hepatocellular carcinoma cells. (a) INTS6 mRNA levels increased after dsRNA-915 treatment in HepG2 cells. However, the expression of Wnt-targeted signals (cyclin D1, Fra1 and MET) did not change. The results were standardized to those of the dsControl group, and the data are presented as the mean ± SD of three independent real-time PCR experiments. (b) The β-catenin protein was analyzed using a green fluorescent reagent. The aberrant expression and intracellular localization of β-catenin protein were observed despite dsRNA-915 treatment in HepG2 cells