1,604
Views
11
CrossRef citations to date
0
Altmetric
Research Paper

Loss of p53 expression in cancer cells alters cell cycle response after inhibition of exportin-1 but does not prevent cell death

, , , &
Pages 1329-1344 | Received 28 Feb 2018, Accepted 17 May 2018, Published online: 23 Jul 2018

Figures & data

Figure 1. Loss of p53 expression does not prevent cell loss after treatment with selinexor. Three p53 expression-matched cell lines were treated with a titration of selinexor from 1nM to 10μM for 72 hours and the relative remaining cell population was subjected to quantification of ATP. (A, B) Wildtype HT-1080 cells have a calculated EC50 value of 87.1nM, matched HT-1080 cells without p53 expression have an EC50 of 152.1nM. (C, D) Wildtype MCF7 cells have a calculated EC50 value of 406.1nM, matched MCF7 cells without p53 expression have an EC50 of 330.6nM. (E, F) Wildtype HCT116 cells have a calculated EC50 value of 207.7nM, matched HCT116 cells without p53 expression have an EC50 of 437.1nM. Note, all cell lines show a strong response and are mostly lost at 1μM, except wildtype MCF7, which show some survival (C).
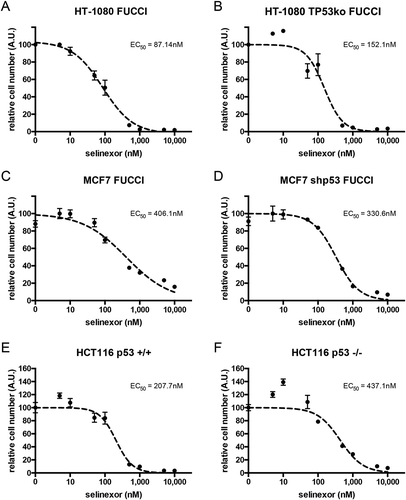
Figure 1. Loss of p53 expression does not prevent cell loss after treatment with selinexor. Three p53 expression-matched cell lines were treated with a titration of selinexor from 1nM to 10μM for 72 hours and the relative remaining cell population was subjected to quantification of ATP. (A, B) Wildtype HT-1080 cells have a calculated EC50 value of 87.1nM, matched HT-1080 cells without p53 expression have an EC50 of 152.1nM. (C, D) Wildtype MCF7 cells have a calculated EC50 value of 406.1nM, matched MCF7 cells without p53 expression have an EC50 of 330.6nM. (E, F) Wildtype HCT116 cells have a calculated EC50 value of 207.7nM, matched HCT116 cells without p53 expression have an EC50 of 437.1nM. Note, all cell lines show a strong response and are mostly lost at 1μM, except wildtype MCF7, which show some survival (C).

Figure 2. Single cell longitudinal tracking of selinexor response indicates faster and greater cell loss without p53 expression. (A, B) Individual matched HT-1080 and MCF7 cells were tracked and population survival curves were plotted. After an initial delay, cells without p53 expression (black lines) are lost faster than wildtype cells (grey lines). Overall cell loss is greater in cells without p53; HT-1080 40%, and HT-1080 TP53ko 20% survival – and – MCF7 50%, and MCF7 shp53 30% survival. (C, D) Daughter cell populations were parsed out to document any sensitivity. For both HT-1080 and MCF7, daughter cells with p53 expression (grey lines) are lost somewhat faster than the respective total population (A, B) and daughters lacking p53 (black lines) show faster and more extensive cell loss. (A, B) >150 cells tracked for each cell line. (C, D) >70 daughter cells tracked for each cell line.
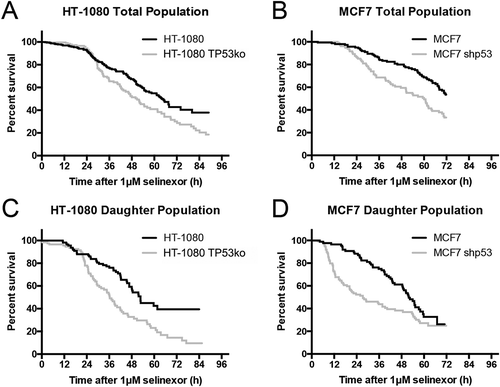
Figure 2. Single cell longitudinal tracking of selinexor response indicates faster and greater cell loss without p53 expression. (A, B) Individual matched HT-1080 and MCF7 cells were tracked and population survival curves were plotted. After an initial delay, cells without p53 expression (black lines) are lost faster than wildtype cells (grey lines). Overall cell loss is greater in cells without p53; HT-1080 40%, and HT-1080 TP53ko 20% survival – and – MCF7 50%, and MCF7 shp53 30% survival. (C, D) Daughter cell populations were parsed out to document any sensitivity. For both HT-1080 and MCF7, daughter cells with p53 expression (grey lines) are lost somewhat faster than the respective total population (A, B) and daughters lacking p53 (black lines) show faster and more extensive cell loss. (A, B) >150 cells tracked for each cell line. (C, D) >70 daughter cells tracked for each cell line.

Figure 3. Cell cycle signatures after treatment with selinexor indicate p53-dependent G1-phase arrest. Cell cycle distribution was monitored over time in the p53 matched cell lines using the FUCCI system. (A, B) Mock (0.1% DMSO) treated HT-1080 and HT-1080 TP53ko cell lines show no obvious change in cell cycle distribution over time until the cultures become highly dense (Videos S1 and S2), then the populations become somewhat enriched in G1-phase cells (white). (C, D) After treatment with selinexor, wildtype HT-1080 cells persistently accumulate to 80% G1-phase (white) and lose G1/S- (grey) and S/G2-phase (black) cells as the overall cell population is lost (Video S3), but HT-1080 TP53ko cells are only 20–25% G1-phase and instead show an accumulation of G1/S- and S/G2-phase cells as the overall cell population is lost (Video S4). (E, F) Mock (0.1% DMSO) treated MCF7 and MCF7 shp53 cell lines show no obvious change in cell cycle distribution over time until the cultures become highly dense after 24 hours, at which point the populations are enriched for G1-phase cells. (G, H) After treatment with selinexor, wildtype MCF7 cells persistently accumulate to >95% G1-phase and lose G1/S- and S/G2-phase cells as the overall cell population is lost (Video S7). MCF7 shp53 cells also accumulate to >95% G1-phase G1-phase as the overall population is lost, and this is after an initial increase in G1/S- and S/G2-phase up to 16 hours (Video S8). >120 cells tracked for each condition and time point.
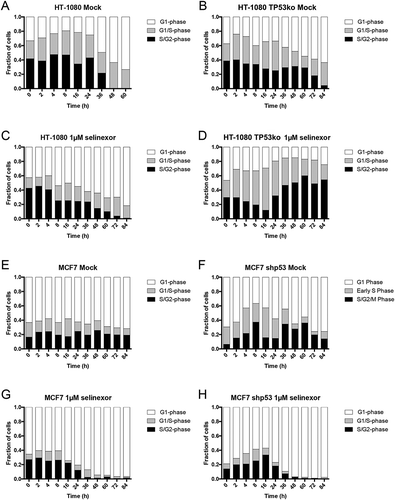
Figure 3. Cell cycle signatures after treatment with selinexor indicate p53-dependent G1-phase arrest. Cell cycle distribution was monitored over time in the p53 matched cell lines using the FUCCI system. (A, B) Mock (0.1% DMSO) treated HT-1080 and HT-1080 TP53ko cell lines show no obvious change in cell cycle distribution over time until the cultures become highly dense (Videos S1 and S2), then the populations become somewhat enriched in G1-phase cells (white). (C, D) After treatment with selinexor, wildtype HT-1080 cells persistently accumulate to 80% G1-phase (white) and lose G1/S- (grey) and S/G2-phase (black) cells as the overall cell population is lost (Video S3), but HT-1080 TP53ko cells are only 20–25% G1-phase and instead show an accumulation of G1/S- and S/G2-phase cells as the overall cell population is lost (Video S4). (E, F) Mock (0.1% DMSO) treated MCF7 and MCF7 shp53 cell lines show no obvious change in cell cycle distribution over time until the cultures become highly dense after 24 hours, at which point the populations are enriched for G1-phase cells. (G, H) After treatment with selinexor, wildtype MCF7 cells persistently accumulate to >95% G1-phase and lose G1/S- and S/G2-phase cells as the overall cell population is lost (Video S7). MCF7 shp53 cells also accumulate to >95% G1-phase G1-phase as the overall population is lost, and this is after an initial increase in G1/S- and S/G2-phase up to 16 hours (Video S8). >120 cells tracked for each condition and time point.

Figure 4. Cell fate distribution after treatment with selinexor changes when p53 expression is lost, but cells remain death sensitive. (A-C) Cell fates for the total, parental, and daughter cell populations for HT-1080 and MCF7 p53-matched cell lines. Cell fates were classified into death (black), arrest (grey, cell remains at end of time-lapse), or division (white). For the total population, cells without p53 expression show increased cell death, with a corresponding decrease in arrest. When the populations are parsed into parental and daughter cells, there is a propensity for the daughters to die, with 60% or more being lost, and the remained in an arrested state; no daughter cells progress to a second cell division. (D-F) Cell cycle-associated fates of parental cells were tracked. (D) TP53 wildtype cells show predominantly death and arrest if treated in G1-phase, that upon loss of p53 results in increased cell divisions. (E) When parental HT-1080 cells are treated in G1/S-phase the percent of cells that progress to cell division increases for wildtype cells, and remains unchanged for HT-1080 TP53ko. Essentially all MCF7 cells treated in G1/S-phase progress to cell division. (F) For S/G2-phase cells, more than 90% progress to cell division, regardless of p53 expression status. (G-I) Cell cycle-associated cell fates of the daughter cells were tracked. (G) TP53 wildtype daughter cells resulting from a parent cell treated in G1-phase show 80% or greater arrest, whereas daughter cells without p53 expression show at least 70% cell death. (H) When parental TP53 wildtype HT-1080 or MCF7 cells are treated in G1/S-phase, any resulting daughter cells show increased cell death compared to treatment in G1-phase, where arrest is most common in the daughter cells, whereas daughter cells without p53 expression continue to show strong cell death. (I) All daughter cells resulting from a parent treated in S/G2-phase show 60% or greater cell death and 40% or more arrest. >150 cells tracked for each cell line.
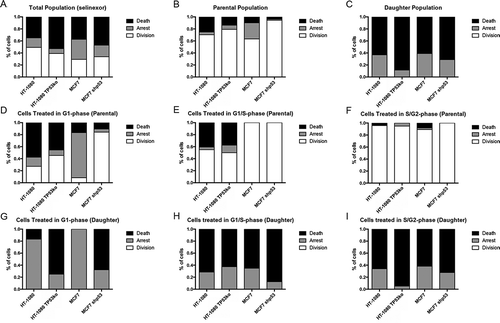
Figure 4. Cell fate distribution after treatment with selinexor changes when p53 expression is lost, but cells remain death sensitive. (A-C) Cell fates for the total, parental, and daughter cell populations for HT-1080 and MCF7 p53-matched cell lines. Cell fates were classified into death (black), arrest (grey, cell remains at end of time-lapse), or division (white). For the total population, cells without p53 expression show increased cell death, with a corresponding decrease in arrest. When the populations are parsed into parental and daughter cells, there is a propensity for the daughters to die, with 60% or more being lost, and the remained in an arrested state; no daughter cells progress to a second cell division. (D-F) Cell cycle-associated fates of parental cells were tracked. (D) TP53 wildtype cells show predominantly death and arrest if treated in G1-phase, that upon loss of p53 results in increased cell divisions. (E) When parental HT-1080 cells are treated in G1/S-phase the percent of cells that progress to cell division increases for wildtype cells, and remains unchanged for HT-1080 TP53ko. Essentially all MCF7 cells treated in G1/S-phase progress to cell division. (F) For S/G2-phase cells, more than 90% progress to cell division, regardless of p53 expression status. (G-I) Cell cycle-associated cell fates of the daughter cells were tracked. (G) TP53 wildtype daughter cells resulting from a parent cell treated in G1-phase show 80% or greater arrest, whereas daughter cells without p53 expression show at least 70% cell death. (H) When parental TP53 wildtype HT-1080 or MCF7 cells are treated in G1/S-phase, any resulting daughter cells show increased cell death compared to treatment in G1-phase, where arrest is most common in the daughter cells, whereas daughter cells without p53 expression continue to show strong cell death. (I) All daughter cells resulting from a parent treated in S/G2-phase show 60% or greater cell death and 40% or more arrest. >150 cells tracked for each cell line.

Figure 5. Treatment with nutlin-3a favors G1-phase accumulation regardless of p53 expression. (A, B) Cell survival curves indicate treatment with nutlin-3a results in 35–40% cell loss in HT-1080 cells regardless of p53 expression, and approximately 10% loss in wildtype MCF7 cells, and no loss in MCF7 shp53 cells (black line = wildtype, grey line = p53 absent). (C-F) FUCCI status over time after nutlin-3a treatment indicates a trend toward G1-phase (white) arrest for all cell lines. (C) Wildtype HT-1080 cells accumulate to approximately 80% G1-phase 24 hours after treatment, and are nearly entirely G1-phase after that; this is sooner and stronger than after treatment with selinexor (, Video S9). (D) HT-1080 TP53ko show slower accumulation in G1-phase than wildtype cells, and reach approximately 60% (Video S10). (E, F) MCF7 and MCF7 shp53 cells both show approximately 70% G1-phase 24 hours after treatment, and are nearly entirely G1-phase after that; this is like treatment with selinexor but with different kinetics at early time points post-treatment (, Videos S11 and S12). ≥100 cells tracked for each condition and time point.
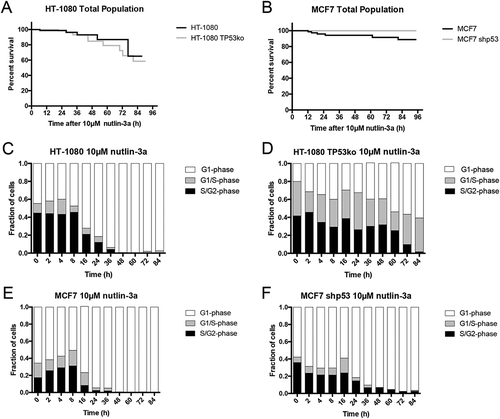
Figure 5. Treatment with nutlin-3a favors G1-phase accumulation regardless of p53 expression. (A, B) Cell survival curves indicate treatment with nutlin-3a results in 35–40% cell loss in HT-1080 cells regardless of p53 expression, and approximately 10% loss in wildtype MCF7 cells, and no loss in MCF7 shp53 cells (black line = wildtype, grey line = p53 absent). (C-F) FUCCI status over time after nutlin-3a treatment indicates a trend toward G1-phase (white) arrest for all cell lines. (C) Wildtype HT-1080 cells accumulate to approximately 80% G1-phase 24 hours after treatment, and are nearly entirely G1-phase after that; this is sooner and stronger than after treatment with selinexor (Figure 3, Video S9). (D) HT-1080 TP53ko show slower accumulation in G1-phase than wildtype cells, and reach approximately 60% (Video S10). (E, F) MCF7 and MCF7 shp53 cells both show approximately 70% G1-phase 24 hours after treatment, and are nearly entirely G1-phase after that; this is like treatment with selinexor but with different kinetics at early time points post-treatment (Figure 3, Videos S11 and S12). ≥100 cells tracked for each condition and time point.

Figure 6. Selinexor combined with nutlin-3a alters cell survival and cell cycle signatures compared to treatment with single agents. (A, B) Cell survival curves indicate that selinexor and nutlin-3a combine to decrease cell survival except in HT-1080 TP53ko cells (A, grey line), which show a small decrease in cell loss compared to with selinexor treatment alone (). (C, D) HT-1080 and HT-1080 TP53ko show approximately 50% and 30% G1-phase (white), considerably less than after treatment with single agents, and a correspondingly increased G1/S- (grey) and S/G2-phase (black) populations (compare to and , Videos S13 and S14). (E, F) Different than HT-1080 and HT-1080 TP53ko cells, MCF7 and MCF7 shp53 accumulate to nearly 100% G1-phase as they die. The G1-phase arrest appears slightly greater for wildtype MCF7 cells after treatment for 24 hours compared to single agents and to MCF7 shp53 cells (see and for comparison, Videos S15 and S16). 100 cells tracked for HT-1080, HT-1080 TP53ko, and MCF7 shp53, 80 cells tracked for MCF7.
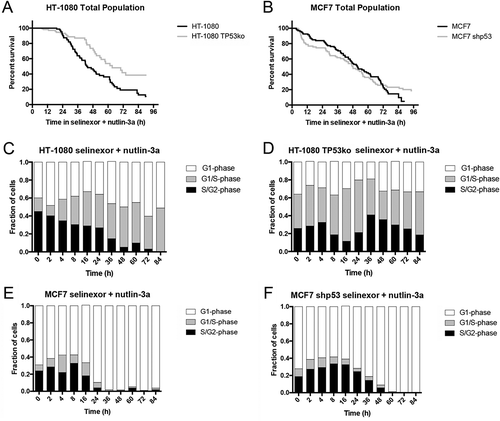
Figure 6. Selinexor combined with nutlin-3a alters cell survival and cell cycle signatures compared to treatment with single agents. (A, B) Cell survival curves indicate that selinexor and nutlin-3a combine to decrease cell survival except in HT-1080 TP53ko cells (A, grey line), which show a small decrease in cell loss compared to with selinexor treatment alone (Figure 2). (C, D) HT-1080 and HT-1080 TP53ko show approximately 50% and 30% G1-phase (white), considerably less than after treatment with single agents, and a correspondingly increased G1/S- (grey) and S/G2-phase (black) populations (compare to Figures 3 and 5, Videos S13 and S14). (E, F) Different than HT-1080 and HT-1080 TP53ko cells, MCF7 and MCF7 shp53 accumulate to nearly 100% G1-phase as they die. The G1-phase arrest appears slightly greater for wildtype MCF7 cells after treatment for 24 hours compared to single agents and to MCF7 shp53 cells (see Figures 3 and 5 for comparison, Videos S15 and S16). 100 cells tracked for HT-1080, HT-1080 TP53ko, and MCF7 shp53, 80 cells tracked for MCF7.

Figure 7. Summary of the effects of loss of p53 expression on treatment with selinexor, nutlin-3a, and selinexor with nutlin-3a. For selinexor treatment alone, overall cell death is increased 20% in HT-1080 (top) and MCF7 (bottom) cells when p53 expression is absent. For HT-1080, p53 plays an important role in cell-cycle distribution after selinexor treatment; G1-phase (white), G1/S-phase (grey), S/G2-phase (black). For MCF7, cells accumulate in G1-phase regardless of treatment and p53 expression. Cell death is least in all cell lines for nutlin-3a treatment, and for MCF7 cell death is dependent on p53 expression. For selinexor combined with nutlin-3a treatment, cell death is increased in all cell lines compared to singe drug treatments, except for HT-1080 TP53ko.
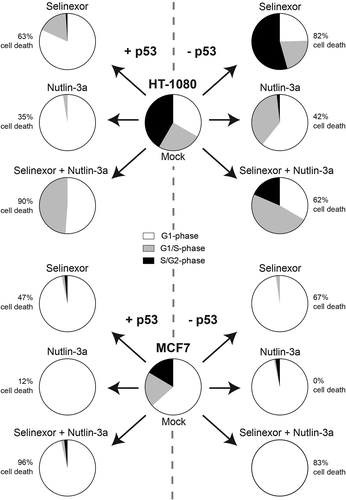
Figure 7. Summary of the effects of loss of p53 expression on treatment with selinexor, nutlin-3a, and selinexor with nutlin-3a. For selinexor treatment alone, overall cell death is increased 20% in HT-1080 (top) and MCF7 (bottom) cells when p53 expression is absent. For HT-1080, p53 plays an important role in cell-cycle distribution after selinexor treatment; G1-phase (white), G1/S-phase (grey), S/G2-phase (black). For MCF7, cells accumulate in G1-phase regardless of treatment and p53 expression. Cell death is least in all cell lines for nutlin-3a treatment, and for MCF7 cell death is dependent on p53 expression. For selinexor combined with nutlin-3a treatment, cell death is increased in all cell lines compared to singe drug treatments, except for HT-1080 TP53ko.
Supplemental material

Supplemental Material

Download Zip (26 MB)

Reprints and Corporate Permissions

Please note: Selecting permissions does not provide access to the full text of the article, please see our help page How do I view content?

To request a reprint or corporate permissions for this article, please click on the relevant link below:

Academic Permissions

Please note: Selecting permissions does not provide access to the full text of the article, please see our help page How do I view content?

Obtain permissions instantly via Rightslink by clicking on the button below:

If you are unable to obtain permissions via Rightslink, please complete and submit this Permissions form. For more information, please visit our Permissions help page.