Figures & data
Figure 1. Morphological changes in small intestine of NEC rats.
NEC rat model was induced by hand feeding and exposure to asphyxia/cold-stress, and the neonatal rats that were obtained after spontaneous vaginally delivery at full term and mother-fed were used as the control rats. (A) HE staining was performed to observe the pathological changes in small intestine. HE pathological scores in the small intestine were blindly evaluated by three independent evaluators to determine the NEC injury. Rats with histological scores ≥2 were defined as having NEC. Scale bar: 20 μM. (B) Immunohistochemistry of PCNA was performed to evaluate small intestine proliferation. The percentage of PCNA positive cells was calculated as the percentage of positive nuclei (brown) in 10 randomly selected high-power fields at x400 magnification. Scale bar: 20 μM. (C) TUNEL staining was performed to evaluate small intestine apoptosis. The percentage of TUNEL positive cells was calculated as the percentage of positive nuclei (brown) in 10 randomly selected high-power fields at x400 magnification. Scale bar: 20 μM. **p < 0.01 vs. Control group.
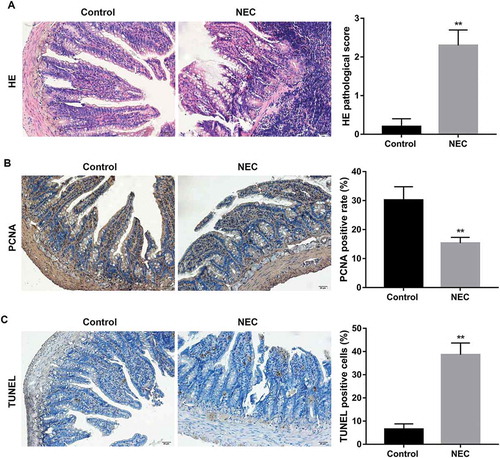
Figure 2. Expression of TNF-α, p-ERK1/2, and autophagy-related proteins in NEC rats.
Levels of TNF-α in serum (A) and small intestinal homogenate (B) in NEC rats were examined using ELISA test. Western blot was performed to detect the protein expression of p-ERK1/2 (C), LC3II/LC3I and Beclin-1 (D) in small intestine of NEC rats. The quantitative analysis of their relative protein expression normalized to GAPDH using Image-Pro Plus 6.0 software was shown. **p < 0.01 vs. Control group.
Figure 3. Autophagy involved in the decreased proliferation and increased apoptosis in IEC-6/NEC.
The IEC-6 cells were stimulated with 100 μg/mL LPS for 3 h to establish NEC in vitro cell model (IEC-6/NEC, LPS group), and the cells treated with equal volume of culture medium served as the control (Control group). (A) MTT assay was performed to determine the effects of LPS on IEC-6 proliferation. (B) Flow cytometry analysis was performed to evaluate the effects of LPS on IEC-6 apoptosis. (C) Western blot was performed to detect the protein expression of LC3II/LC3I and Beclin-1 in IEC-6 cells stimulated with LPS or not. The quantitative analysis of their relative protein expression normalized to GAPDH using Image-Pro Plus 6.0 software was shown. (D) MDC fluorescence staining of autophagic vacuoles in IEC-6 cells treated with LPS or not. (E) MTT assay was performed to determine the effects of autophagy inhibitor wortmannin or LY294002 on the proliferation of the LPS-induced IEC-6/NEC cells. (F) Flow cytometry analysis was performed to evaluate the effects of autophagy inhibitor wortmannin or LY294002 on the apoptosis of the LPS-induced IEC-6/NEC cells. **p < 0.01 vs. Control group; ##p < 0.01 vs. LPS group.
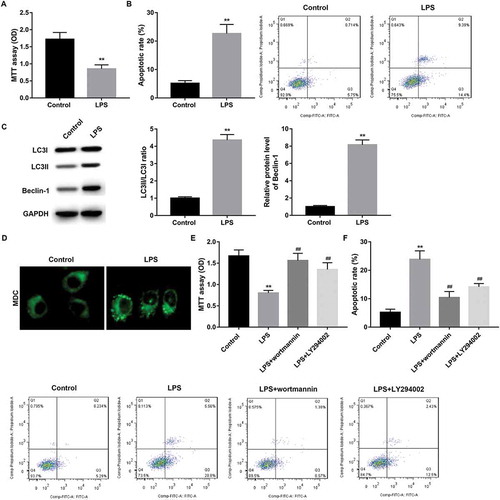
Figure 4. TNF-α suppressed proliferation and promoted apoptosis in IEC-6/NEC.
The IEC-6 cells were stimulated with 100 μg/mL LPS for 3 h to establish NEC in vitro cell model (IEC-6/NEC, LPS group), and the cells treated with equal volume of culture medium served as the control (Control group). (A) The TNF-α mRNA expression in IEC-6 cells stimulated with LPS or not was measured by RT-qPCR. (B) The TNF-α level in the cell supernatant of IEC-6 cells stimulated with LPS or not was measured by Western blot. (C) Effects of TNF-α treatment at increasing concentrations (5, 10, 15, 20, 30 ng/mL) for 6 h on the proliferation of the LPS-induced IEC-6/NEC cells were evaluated by MTT assays. (D) Effects of TNF-α treatment at increasing concentrations (5, 10, 15, 20, 30 ng/mL) for 6 h on the apoptosis of the LPS-induced IEC-6/NEC cells were evaluated by flow cytometry cell apoptosis analysis. **p < 0.01 vs. Control group; #p < 0.05 vs. LPS group.
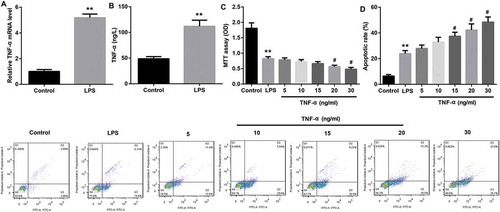
Figure 5. TNF-α suppressed proliferation and promoted apoptosis in IEC-6/NEC via autophagy induction.
The IEC-6 cells were stimulated with 100 μg/mL LPS for 3 h to establish NEC in vitro cell model (IEC-6/NEC, LPS group), and the cells treated with equal volume of culture medium served as the control (Control group). (A) Effects of TNF-α treatment at increasing concentrations (5, 10, 15, 20, 30 ng/mL) on the protein expression of LC3II/LC3I and Beclin-1 in the LPS-induced IEC-6/NEC cells were evaluated by Western blot. The quantitative analysis of their relative protein expression normalized to GAPDH using Image-Pro Plus 6.0 software was shown. (B) Effects of TNF-α treatment at increasing concentrations (5, 10, 15, 20, 30 ng/mL) on the formation of autophagic vacuoles in the LPS-induced IEC-6/NEC cells were evaluated by MDC fluorescence staining. (C) MTT assay was performed to evaluate the effects of pre-treatment with autophagy inhibitor wortmannin or LY294002 on the cell proliferation of the LPS-induced IEC-6/NEC cells treated with TNF-α (20 ng/mL). (D) Flow cytometry analysis was performed to evaluate the effects of pre-treatment with autophagy inhibitor wortmannin or LY294002 on the cell apoptosis of the LPS-induced IEC-6/NEC cells treated with TNF-α (20 ng/mL). **p < 0.01 vs. Control group; #p < 0.05 vs. LPS group; $p < 0.05 vs. TNF-α group.
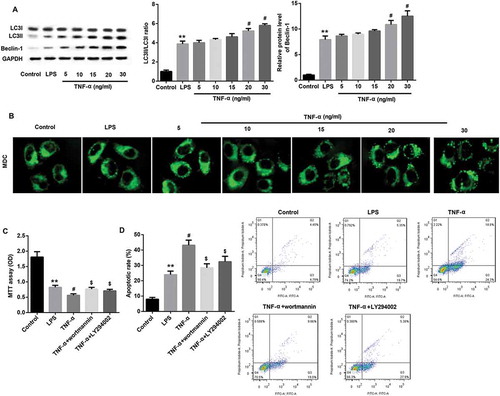
Figure 6. TNF-α induced autophagy via ERK1/2 signaling in IEC-6/NEC.
The IEC-6 cells were stimulated with 100 μg/mL LPS for 3 h to establish NEC in vitro cell model (IEC-6/NEC, LPS group), and the cells treated with equal volume of culture medium served as the control (Control group). (A) Effects of TNF-α treatment at increasing concentrations (5, 10, 15, 20, 30 ng/mL) on the protein expression of p-ERK1/2 in the LPS-induced IEC-6/NEC cells were evaluated by Western blot. The quantitative analysis of p-ERK1/2/ERK1/2 protein expression ratio normalized to GAPDH using Image-Pro Plus 6.0 software was shown. (B) Effects of pre-treatment with ERK1/2 pathway inhibitor U0126 on the protein expression of LC3II/LC3I and Beclin-1 in the LPS-induced IEC-6/NEC cells treated with TNF-α (20 ng/mL) were evaluated by Western blot. The quantitative analysis of their protein expression normalized to GAPDH using Image-Pro Plus 6.0 software was shown. (C) Effects of pre-treatment with ERK1/2 pathway inhibitor U0126 on the formation of autophagic vacuoles in the LPS-induced IEC-6/NEC cells treated with TNF-α (20 ng/mL) were evaluated by MDC fluorescence staining. **p < 0.01 vs. Control group; #p < 0.05 vs. LPS group; $p < 0.05 vs. TNF-α group.
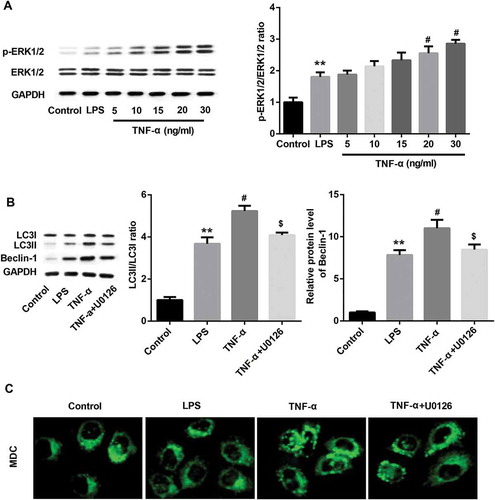
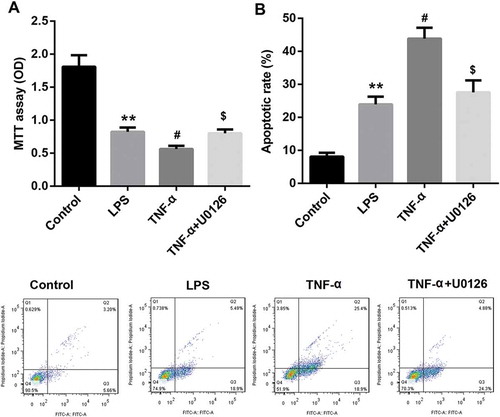
Figure 7. TNF-α suppressed proliferation and promoted apoptosis in IEC-6/NEC cells via ERK1/2 signaling.
The IEC-6 cells were stimulated with 100 μg/mL LPS for 3 h to establish NEC in vitro cell model (IEC-6/NEC, LPS group), and the cells treated with equal volume of culture medium served as the control (Control group). (A) Effects of pre-treatment with ERK1/2 pathway inhibitor U0126 on the cell proliferation of the LPS-induced IEC-6/NEC cells treated with TNF-α (20 ng/mL) were evaluated by MTT assay. (B) Effects of pre-treatment with ERK1/2 pathway inhibitor U0126 on the cell apoptosis of the LPS-induced IEC-6/NEC cells treated with TNF-α (20 ng/mL) were evaluated by flow cytometry assay. **p < 0.01 vs. Control group; #p < 0.05 vs. LPS group; $p < 0.05 vs. TNF-α group.