Figures & data
Figure 1. Structure and synthesis of new cap analogs. (i) MeCN, DMAP, Et3N, Ac2O, MeOH; (ii) NPE-OH, PPh3, DIAD, toluene, (iii) HF/pyridine, tBuONO, pyridine; (iv) RNH2, DMSO; (CH3)2NH/EtOH; (v) POCl3, trimethyl phosphate; (vi) MeI, DMSO; (vii) imGDP, ZnCl2, DMF
Table 1. Inhibition of capped luciferase mRNA translation in RRL lysate by N2-modified cap analogs. Data represent the means ± SD of at least three independent repeats. Statistical significance between m7GpppG and N2-modified cap analogs was determined using ANOVA and Tukey’s multiple comparison tests using GraphPad Prism 6
Table 2. Translational properties of differently capped mRNA in RRL and HEK293 cells. Data represent the means ± SD of at least three independent repeats
Figure 2. Translation efficiency of analog-capped mRNAs in HEK293 cells. (a) Luciferase activity measured in HEK293 cells transfected with mRNAs capped with following analogs: bn2m27,3ʹOGpppG, bn2m27,2ʹOGpppG, (p-OCH3bn)2m27,3ʹOGpppG, m27,3ʹ-OGpppG, m7GpppG. Luciferase activity was normalized to the protein concentration of samples and then expressed relatively to controls. The graph shows the mean of 4 independent experiments with ± SD. (b) Immunofluorescence staining of luciferase protein. Expression level of luciferase was detected after 24 h of mRNA transfection of HEK293 in use of anti-luciferase antibodies followed by anti-mouse FITC antibody (green signal). Cell nuclei were visualized with DAPI (blue color)
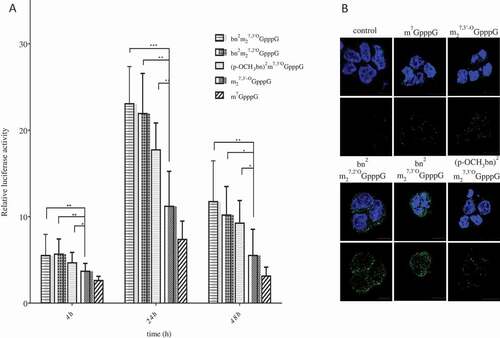
Figure 3. Stability of analog-capped mRNAs. (a) SpDcp1/2 hydrolysis of capped 34nt-RNAs. The transcripts were synthesized with T7 polymerase in use of an EcoRI digested pSP-luc+ template. Samples were resolved on 16% denaturing polyacrylamide/urea gel. Stained with SYBR gold. (b) Effect of the 5ʹ cap analogs on half–life of mRNAs in HEK293 after lipofection. RNA was isolated from cells 4, 24 and 72 h after transfection. Luciferase transcripts levels were quantified by qRT-PCR. ACTB gene was used as a reference gene. Data represent the means ± SD of three independent repeats
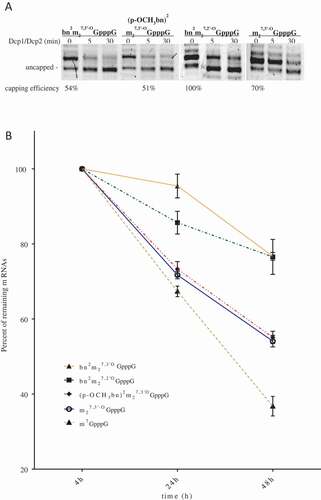
Table 3. Susceptibility of differently capped mRNAs to decapping by SpDcp1/Dcp2 complex
Table 4. Stability of differently capped mRNAs in HEK293 cells
Table 5. Binding affinities of N2-modified cap analogs to eIF4E derived from fluorescence titrations in HEPES/KOH 50 mM pH 7.2, KCl 200 mM, DTT 1 mM, EDTA 0.5 mM, at 20°C
Figure 4. Increased affinity to eIF4E of N2-modified cap analogs. (a) Binding curves obtained by intrinsic protein fluorescence quenching upon the complex formation with (◆) bn2m27,2ʹOGpppG, (○) m27,2ʹ-OGpppG, (■) bn2m27,3ʹOGpppG, and (▼) (p-OCH3bn)2m27,3ʹOGpppG. (b) Correlation between the affinity to eIF4E and the relative cap-dependent translation efficiency