Figures & data
Figure 1. Results of Let-7 family generated based on METABRIC database analysis.
Clinical analysis of Let-7 family of miRNAs were conducted and concluded relying on Kaplan-Meier analysis (http://kmplot.com/analysis/), where the huge amount of data and trends of clinical specimens in analyzing survival prognosis could be found. Enrolled samples number was indicated below each diagram. Let-7a, Let-7b, Let-7c, Let-7d, Let-7e, Let-7f, Let-7g and Let-7i were generated and captured from METABRIC data base, as were indicated in the figures. Results of Let-7a, Let-7b, Let-7c, Let-7e, Let-7f and Let-7g showed their significant correlation to better prognosis.
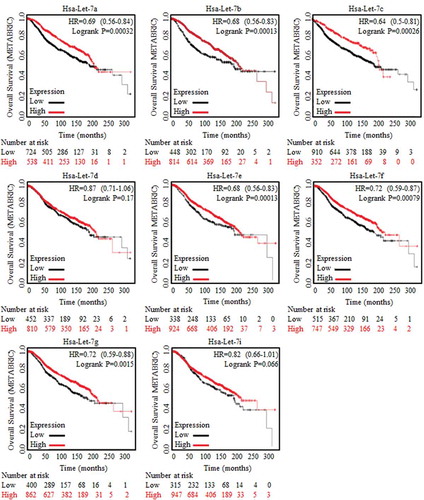
Figure 2. Wnt signaling activation were strongly correlated with poorer prognosis.
A cluster of Wnt signaling factors were selected and applied for survival risk analysis by using CBIOPORTAL FOR CANCER GENOMIC (http://www.cbioportal.org/). (a) Alternation (Red line, 786 cases) was defined with the amplification only mode, and the amplification of Wnt signaling factors were detected and referred to shorter survival periods significantly, p = 0.0013. (b) Heatmap results of factors of Wnt signaling clusters (18 genes) from data base of Breast Cancer Samples with sequencing and CNA data (2051 samples) were showed, and multiple Wnt signaling factors were universally highly overexpressed. Kaplan-Meier data analysis was also made, and results revealed the tumor suppressive miR-146 (c), and the oncogenic Snai1 (d) when predicating breast cancer prognosis. Enrolled samples number was indicated below the diagram. (e) Wnt signaling effector of TCF-4 was strongly correlated to the stem cells’ effector (left) and the ratio of stem cells with ALDH1A1 phenotype (right). (f) The predicated Wnt signaling activator of non-coding H19 was strongly correlated with Snai1 overexpression.
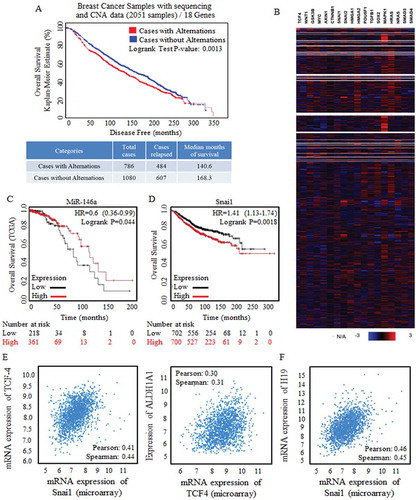
Figure 3. Let-7c and Wnt signaling inhibitor blocks the symmetric division.
Wnt activation inhibitor of Axitinib was used as positive control. (a) Both Axitinib and Let-7c effectively promoted the asymmetric division (above), suppressed the symmetric division (below). The differences of ACD ratios among groups of Let-7c, Let-7b, and Axitinib in T47-D (F = 0.223, p = 0.801), MDA-MB-231 (F = 2.066, p = 0.136) and BT-20 (F = 0.526, p = 0.594) are not significant, and similarly, the differences of SCD ratios among groups of Let-7c, Let-7b, and Axitinib in T47-D (F = 0.584, p = 0.561), MDA-MB-231 (F = 2.159, p = 0.126) and BT-20 (F = 0.253, p = 0.778) are not significant, processing by ANOVA analysis. (b) Images of fluorescence results of EdU dye were shown, and the dividing cells were marked with either the white arrow (SCD) or the yellow arrow (ACD). (c) Axitinib and Let-7c decreased number of the forming spheres significantly (left), which was directly attributed to the self-renewal ability of stem cells, with representative images shown in right. ACD, asymmetric division, SCD, symmetric division. Results were acquired and calculated from six independent experiments.
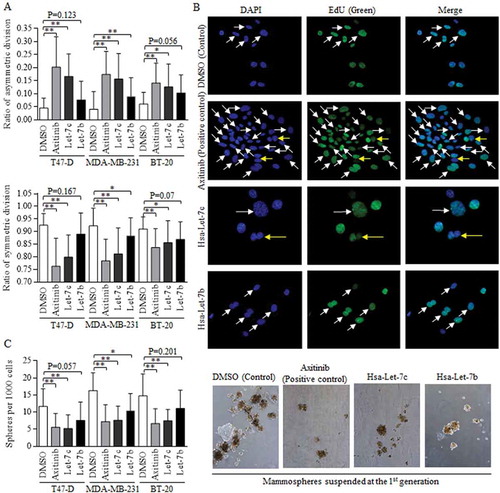
Figure 4. MiR-146 inhibited the Wnt activation through a Let-7c dependent way.
(a) The overexpressed miR-146 and Let-7c both exerted strong inhibition on symmetric division, and promoted the asymmetric division, ** p<0.01. The differences among groups of Let-7c, miR-146, and their combination in T47-D (F = 0.503, p = 0.610), MDA-MB-231 (F = 0.209, p = 0.813) and BT-20 (F = 0.835, p = 0.443) are not significant as written, processing by ANOVA analysis. (b) Enforcement of miR-146, Let-7c, and the combined overexpression all decreased the number of spheres acquired from the 1st generation culturing (left), as were presented (right). (c) Bioinformatic analysis of the potential binding site between miR-146 and the 3’UTR of LIN28 was analyzed and labeled in RED, as indicated. (d) Luciferase assay was conducted with detecting Renilla luciferase activity, and miR-146 decreased the luc-activity of 3’UTR of LIN28 with wild-type sequence effectively, which could be found in breast cancer of three cell lines. The functional status of Wnt signaling was tested by detecting the TCF-4 activity, and both miR-146 overexpression (e) and LIN28 inhibition (f) decreased the luc-activity of 3’UTR of TCF-4 with wild-type sequence (TOP), comparing to the controlled group of 3’UTR of TCF-4 with certain mutant sequence at the targeted region (FOP). G. The TCF-4 activity in groups of enforced miR-146 and Let-7 is similar to that of enforced Let-7 and inhibited LIN28, we hypothesized that miR-146 functioned through the LIN28/Let-7 axis, given the established interaction between LIN28 and Let-7. Results were acquired and calculated from six independent experiments.
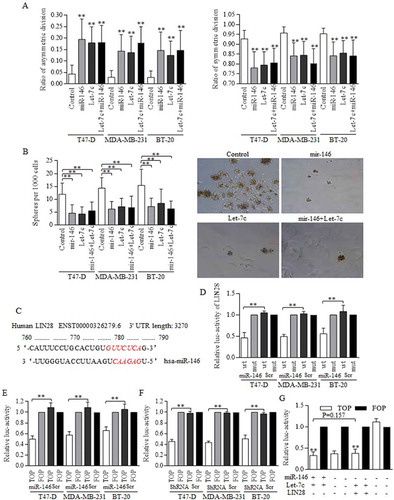
Figure 5. H19 inhibited the Let-7c functions as its competitive sponge molecular.
RNA immunoprecipitation was performed to identify the potential binding site between H19 and Let-7c. (a) Let-7c specific MS2 at the H19 targeted region was effectively enriched in groups of three cell lines, comparing to empty MS2 and the MS2 with mutant H19 region. ShRNA conducted H19 inhibition was successfully achieved (b) however, the inhibition did not influence Let-7c level effectively (c) (d) Let-7c exerted no significant repression on H19 expression level. The potential binding site between H19 and Let-7 was explored and synthesized, and Let-7c degraded the H19 binding site of wild-type effectively (e), and no significant results of Let-7c was detected in groups of H19 of mutant binding region (f). Results were acquired and calculated from three independent experiments.
Figure 6. Wnt activation sustaining of H19 contributed to Let-7 disablement.
To study the possible connection among H19, Let-7, and Wnt signaling in BrCSCs, H19 inhibition was used as the key deregulation process when determining Wnt activity. A. H19 was naturally highly expressed in groups of stem cells in breast cancer. B. Wnt activation were detected in Breast cancer stem cells by using Western blot referred to the key signaling members. C. Wnt signaling could be activated with using either 5mM LiCl or 400 ng/ml of Wnt3a, and the activation status was determined by TCF-4 activity of FOP. D. H19 level went up significantly when Wnt signaling was activated in 293T cells, and the blocking of Wnt cascade with using Axitinib decreased the H19 expression significantly. E. Both H19 inhibition and Axitinib addition stimulated the asymmetric division, and the Wnt signaling activation decreased the ratio of asymmetric division, ** p<0.01 (Student’s t-test). F. Both H19 inhibition and Axitinib addition repressed the symmetric division ** p<0.01 (Student’s t-test). No significant difference was detected when comparing the addition of either Wnt3a (p = 0.0604) or LiCl (p = 0.0455) to control group. G. H19 inhibition decreased the expression levels of multiple Wnt signaling factors. H. H19 inhibition functioned the same way as either combined H19 inhibition and Let-7c overexpression, or combined H19 inhibition and LIN28 inhibition did. In these three groups, TCF-4 activity was much lower than that of controlled group. Results were acquired and calculated from three independent experiments.
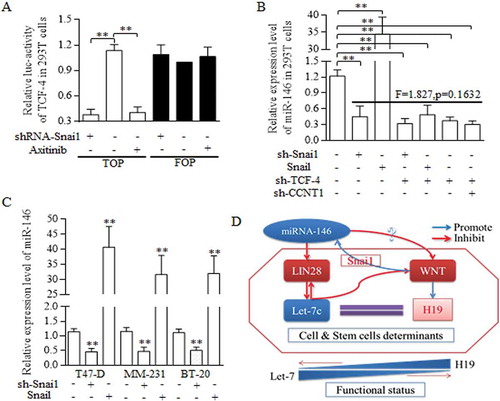
Figure 7. Regulatory loop of miR-146 and Wnt signaling was dependent on the fine regulating conducted by Let-7/Wnt/H19 feedback circle.
A reciprocal regulation between miR-146a and Wnt signaling pathway was dominated and conducted by Snai1. A. TOP/FOP reporter assay. Both Snai1 inhibition and Axitinib addition decreased the TCF-4 activity effectively in 293T cells, comparing to negative and control group, ** p<0.01 (Student’s t-test). B. In 293T cells, snai1 inhibition repressed the miR146 expression level greatly, and Snail transfectants promoted the miR-146 level significantly. What’s more, no significant difference was detected when analyzing the functions of either snai1 inhibition, TCF-4 inhibition, or their combined manipulation in regulations of miR-146 expression. C. Similar results were confirmed in T47-D, MM-231, and BT-20 of breast cancer cell lines, proving the pivotal role of miR-146 in controlling miR-146 level. D. The schematic illustration of the proposed regulative mechanisms of miR-146 in breast cancer stem cells. Two crucial circles formed based on the dual regulation of miR-146/Wnt and Let-7/Wnt loop, which was connected by LIN28. Data represent mean ± s.d, n = 3 independent experiments. Results were acquired and calculated from three independent experiments.