Figures & data
Figure 1. Point mutation of phenylalanine 114 delays azurin entry in cancer cells. (a) Amino acids sequence of azurin from Pseudomonas aeruginosa. Hydrophobic patches are highlighted in blue. (b) 3D structural view of azurin depicting surface hydrophobicity (top view) and ribbon 3D structure (lateral view) of both WT azurin (left panel) and F114A mutant azurin (right panel), identifying the structural positioning of phenylalanine amino acid residue side chain. The amino acid change was generated using SPDB Viewer (v4.01). Surface hydrophobicity was generated using PyMol. (c) Entry of azurin WT and F114A mutant in MCF-7 and HeLa cells. Cells were exposed to 50–100µM of both proteins for 30 minutes (left) and 2 hours (right), after which cells were lysed and protein entry inside cells was determined by Western blot. A cropped representative image of Western blot is depicted. Full-length Western blot images are displayed as supplementary information. (d) Confocal scanning microscopy of Atto 390-labelled WT or F114A azurin proteins. Labeled proteins (10µM) were mixed to non-labeled proteins (to a final concentration of proteins of 100µM), and MCF-7 cells were exposed for 2 hours before fixing and imaging. Cell nuclei are displayed labelled with NucRed and presented in red, labeled WT and mutated azurin proteins are displayed in green
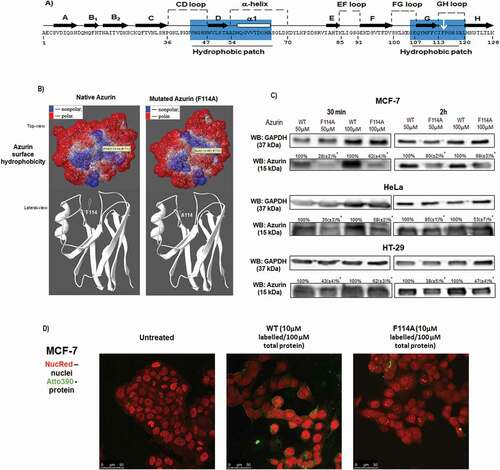
Figure 2. Phenylalanine 114 is important for interaction with GM-1. (a) Azurin interacts with GM-1. Blocking GM-1 with CTxB impairs azurin entry for both WT and F114A azurin mutant. GM-1 was blocked by adding CTxB for 10 minutes, before being treated with 50μM of WT or the mutated azurin proteins for 30 minutes, in MCF-7 (left) and HT-29 (right) cells. A cropped representative image of Western blot is depicted and results are presented as the ratio of band intensity of target protein between azurin treated samples and control samples, both normalized to their respective GAPDH or actin band intensity (* p < 0.05; two-tailed t-student test). Full-length Western blot images are displayed as supplementary information. (b) The effects of WT and F114A azurin in the cells’ lipid raft organization. Cells were grown and treated with both azurin proteins at 100µΜ, 30 minutes or 48h. The glycosphingolipid GM-1 of lipid rafts is marked with CTxB-Alexa488 (green) and the nuclei are stained with DAPI (blue). CTxB-Alexa488 was added for 10 minutes at a final concentration of 1μg/mL right before cells were fixed in formaldehyde and prepared for visualization under the confocal fluorescence microscope. (c) Fluorescence signal intensity was quantified in Image J software for at least 20 cells from experiments performed in different days, as explained in Material and Methods Section. Results are represented as an average of the ratio between fluorescence intensity signal in the plasma membrane and the intracellular signal, excluding the nucleus, ± SD. Results were compared by analysis of variance ANOVA using GraphPad Prism (ver 6)
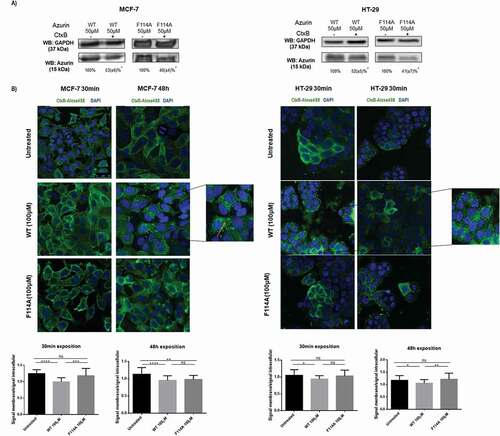
Figure 3. Phenylalanine 114 is important for interaction with caveolin-1. (a) Entry of WT azurin and mutated F114A azurin upon silencing of caveolin-1 by siRNA. Cells were treated with 50μM of WT or the mutated azurin proteins for 30 minutes. Control siRNAs with proteins are the control conditions. A cropped representative image of Western blot is depicted and results are presented as the ratio of band intensity of target protein between azurin treated samples and control samples, both normalized to their respective GAPDH or actin band intensity (* p < 0.05). Full-length Western blot images are displayed as supplementary information. (b) Energy transfer efficiencies of WT and F114A mutant azurin proteins labeled with Att0 390 in the presence of FITC-labed CSD (Caveolin Scaffolding Domain) peptide. Values were calculated as described in the Methods section. (c) Co-immunoprecipitation of caveolin-1 and azurin in MCF-7 and HeLa cells treated with azurin 100 µM for 30 minutes. An antibody to caveolin-1 was incubated with total cell lysates and used to precipitate it from both control and azurin treated total cell lysates. Proteins were separated in SDS-Page gels transferred to membranes which were probed with both anti-caveolin-1 and anti-azurin antibodies. Full-length Western blot images are displayed as supplementary information. (d) Azurin causes a decrease in the protein levels of caveolin-1. A single dose of azurin (50-100 µM) for 48 hours leads to a dose-dependent decrease in two different cancer cell types (MCF-7 and HeLa). A cropped representative image of Western blot is depicted and results are presented as the ratio of band intensity of target protein between azurin treated samples and control samples, both normalized to their respective GAPDH band intensity (* p < 0.05)
Figure 4. Impact of WT or F114A mutant azurin protein on the membrane fluidity of cancer cell lines MCF-7, HeLa and HT-29. (a) Cells were loaded with 5μM of Laurdan after incubation with azurin proteins at 100μM for 30 minutes or 48h. Laurdan GP values were determined as described in Material and Methods. Representative Laurdan GP images are shown. (b) Average GP values after incubation with azurin proteins are shown for the plasma membranes for the three cell lines. WT azurin causes a decrease in the average GP value in all three cell lines, either from 30 minutes or 48 hours of exposure. Average GP values are expressed as mean ± SD from at least 15 individual cells in each condition. Results were compared by analysis of variance ANOVA using GraphPad Prism (ver 6)
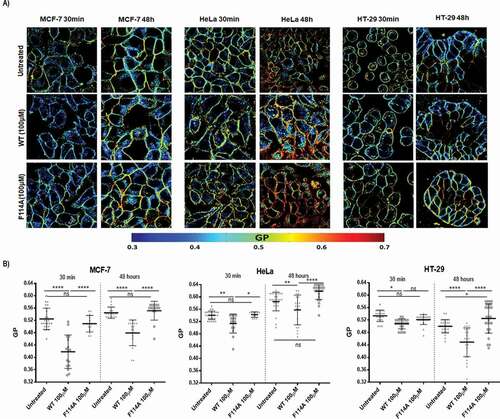
Figure 5. The effect of the combination of WT or F114A mutant azurin proteins with chemotherapeutic agents (paclitaxel and doxorubicin) was determined by MTT assay. Paclitaxel or Doxorubicin, WT azurin or F114A mutant azurin were added alone or in combination for 72hours in MCF-7 (a), HeLa (b) and HT-29 (c) cells. Concentrations are shown above each data point. MTT reagent was added to each well and percentage change in absorbance at 570nm in treated cells relative to untreated controls. Results are represented as percentage of viability decrease (VD), determined as 100% (control) – % of proliferation for each treatment condition. Values represent the mean ± SD. * p < 0.05 each condition vs untreated cells; a p < 0.05 combination vs protein alone; A p < 0.05 combination vs drug alone