
Figures & data
Figure 1. Effect of CCCP gradient concentrations in M2 medium and Ca2+-free SrCl2-CZB medium on oocyte survival. With the increase of CCCP concentrations, the death rate increased gradually in both MII oocytes and parthenogenetic oocytes. Parthenogenetic oocytes had higher death rates (marked with *) than MII oocytes keep in M2 medium. * indicated significant difference (P < 0.05) .
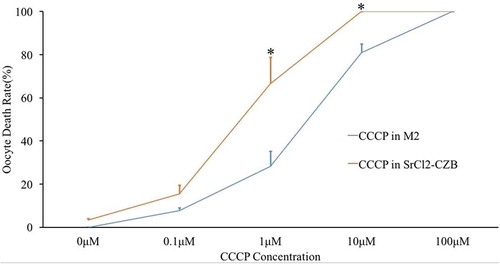
Figure 2. Mitochondrial potential of CCCP-treated oocytes after parthenogenetic activation. (a) Parthenogenetic oocytes stained with JC-1, a potential-sensitive fluorescent mitochondrial dye, which emits red fluorescence in higher membrane potential mitochondria and emits green fluorescence in lower potential mitochondria. Bar indicated 50μm in panel A. (b) Relative fluorescence intensity was compared with that of the 0μM CCCP group. With the increase of CCCP concentrations, high potential mitochondria (red) decreased significantly. * indicated significant difference (P < 0.05) compared with the CTRL group.
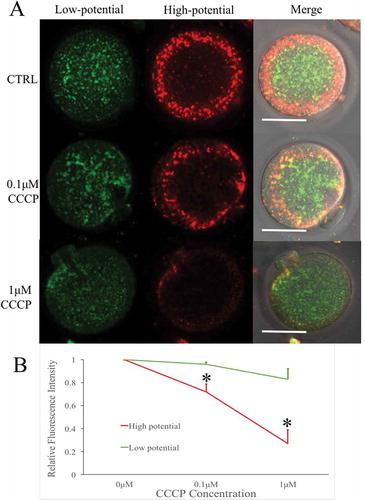
Figure 3. [Ca2+]i oscillation patterns after parthenogenetic activation of oocytes treated with CCCP. (a) [Ca2+]i oscillation patterns were influenced by gradually increasing CCCP concentrations. 0μM group as a control group, and 0.1μM, 1μM, 10μM and 100μM CCCP were respectively added into the parthenogenetic activation medium to observe the effect of CCCP on [Ca2+]i oscillations. (b) [Ca2+]i oscillation parameters in oocytes treated with 0.1μM and 1μM CCCP. With CCCP concentrations increasing from 0μM to 1μM, [Ca2+]i oscillations became gradually diminished. Once the CCCP concentration reached 10μM, there was only a slow increase in [Ca2+]i and no [Ca2+]i oscillations were observed. * indicated significant difference (P < 0.05) .
![Figure 3. [Ca2+]i oscillation patterns after parthenogenetic activation of oocytes treated with CCCP. (a) [Ca2+]i oscillation patterns were influenced by gradually increasing CCCP concentrations. 0μM group as a control group, and 0.1μM, 1μM, 10μM and 100μM CCCP were respectively added into the parthenogenetic activation medium to observe the effect of CCCP on [Ca2+]i oscillations. (b) [Ca2+]i oscillation parameters in oocytes treated with 0.1μM and 1μM CCCP. With CCCP concentrations increasing from 0μM to 1μM, [Ca2+]i oscillations became gradually diminished. Once the CCCP concentration reached 10μM, there was only a slow increase in [Ca2+]i and no [Ca2+]i oscillations were observed. * indicated significant difference (P < 0.05) .](/cms/asset/c3c8ea61-2c0f-465f-bbf2-0b7c97fe5a85/kccy_a_1489179_f0003_oc.jpg)
Figure 4. Effect of L-carnitine and BGP-15 on mitochondrial membrane potential after parthenogenetic activation. (a) Mitochondrial membrane potential after parthenogenetic activation. Bar indicated 50μm in panel A. (b) Relative fluorescence intensity analysis of mitochondrial membrane potential. LC could increase mitochondrial membrane potential (red) intensity. BGP-15 had no significant improvement effect. Red fluorescence indicated mitochondria with higher membrane potential and green fluorescence indicated lower potential mitochondria.* indicated significant difference (P < 0.05) compared to the CTRL group.
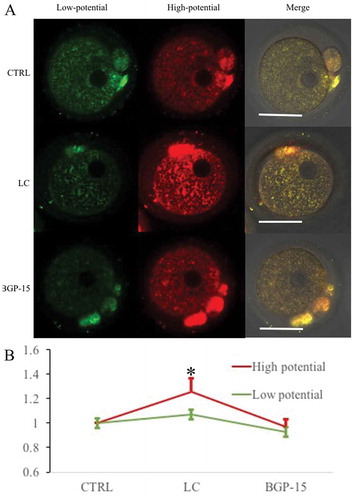
Figure 5. L-carnitine (LC) and BGP-15 affected [Ca2+]i oscillation in parthenogenetic oocytes. (a) Influence of 0.75 mg/ml LC and 30μM BGP-15 on [Ca2+]i oscillation patterns. (b) Relative [Ca2+]i oscillation parameters. [Ca2+]i oscillations of LC-treated oocytes showed significantly faster frequency, shorter cycle, a longer maintaining period and a shorter fluorescence rest. However, after earlier similar patterns, [Ca2+]i oscillations induced by BGP-15 treatment ceased and the peak decreased. * indicated significant difference (P < 0.05) .
![Figure 5. L-carnitine (LC) and BGP-15 affected [Ca2+]i oscillation in parthenogenetic oocytes. (a) Influence of 0.75 mg/ml LC and 30μM BGP-15 on [Ca2+]i oscillation patterns. (b) Relative [Ca2+]i oscillation parameters. [Ca2+]i oscillations of LC-treated oocytes showed significantly faster frequency, shorter cycle, a longer maintaining period and a shorter fluorescence rest. However, after earlier similar patterns, [Ca2+]i oscillations induced by BGP-15 treatment ceased and the peak decreased. * indicated significant difference (P < 0.05) .](/cms/asset/53466b7a-3f09-427f-88c8-7f71dc811ef9/kccy_a_1489179_f0005_oc.jpg)
Figure 6. Mitochondrial membrane potential damage induced by 0.1μM CCCP was improved by LC and BGP-15. (a) Fluorescent staining of mitochondrial membrane potential after different treatments. 0.1μM CTRL group: treated with 0.1μM CCCP and DMSO; 0.1μM LC group: treated with 0.1μM CCCP and 0.75 mg/ml LC; 0.1μM BGP-15 group: treated with 0.1μM CCCP and 30μM BGP-15. (b) Relative fluorescence intensity analysis. Red fluorescence indicated mitochondria with higher membrane potential and green fluorescence indicated lower potential mitochondria. * indicated significant difference (P < 0.05) compared to the 0.1μM CTRL group. Bar indicated 50μm in panel A.
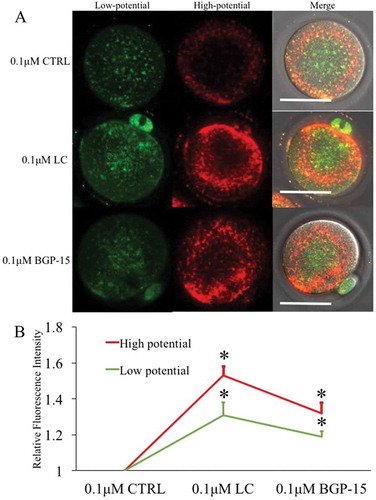
Figure 7. Effects of LC and BGP-15 on mitochondrial membrane potential during in vitro maturation of oocytes. (a) Mitochondrial membrane potential staining of GV oocytes after GVBD inhibition with milrinone. LC improved both high and low mitochondrial membrane potential staining. (b) Mitochondrial membrane potential staining of MII oocytes after IVM. (c) Relative fluorescence intensity analysis. Red fluorescence indicated mitochondria with higher membrane potential and green fluorescence indicated lower potential mitochondria.* indicated significant difference (P < 0.05) compared to CTRL group. Bar indicated 50μm in panel A.
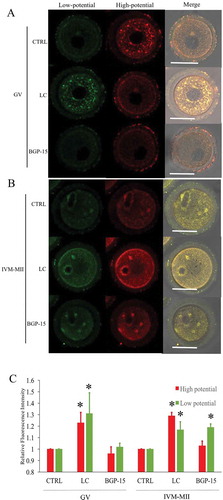
Figure 8. Influence of L-carnitine (LC) and BGP-15 on IVM oocyte oscillations. (a) [Ca2+]i oscillations in IVM-MII oocytes treated by L-carnitine and BGP-15. (b) Relative [Ca2+]i oscillation parameters after treatment with mitochondrial agonists. [Ca2+]i oscillations of LC treatment showed stronger patterns, while BGP-15 significantly reduced the quality of oocyte maturation. * indicated significant difference (P < 0.05) in comparison between the same parameter.
![Figure 8. Influence of L-carnitine (LC) and BGP-15 on IVM oocyte oscillations. (a) [Ca2+]i oscillations in IVM-MII oocytes treated by L-carnitine and BGP-15. (b) Relative [Ca2+]i oscillation parameters after treatment with mitochondrial agonists. [Ca2+]i oscillations of LC treatment showed stronger patterns, while BGP-15 significantly reduced the quality of oocyte maturation. * indicated significant difference (P < 0.05) in comparison between the same parameter.](/cms/asset/a3390214-b6c3-47a1-826b-cce1c82e9262/kccy_a_1489179_f0008_oc.jpg)