
Figures & data
Figure 1. Induction of heterochromatin alteration. Panc1 cells were cultured in inducing medium (induction) or DMEM containing 10% FBS (control) for 48 hrs. Immunofluorescence images show a significant reduction of heterochromatin markers H3K9me3 and HP1 in induced cells. DNA was counterstained by DAPI. Scale bar is equal to 10 μm.
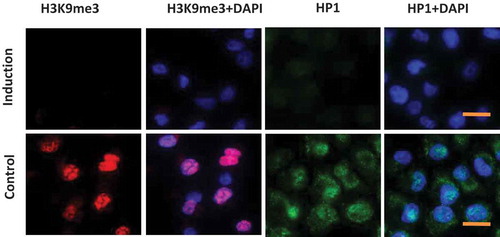
Figure 2. (A) Schematic diagram for the time line of CSCs induction. IM: Inducing medium; SM: Sphere culture medium. (B) Tumorsphere formation of different cancer cell lines. (a, b) Panc1 cells were induced with (a) or without (b) the small molecular compounds as described. In the presence of the compounds, cells formed typical tumorspheres (a); in contrast, in the absence of the compounds, only cell patches were observed (b). (c,d,e) Similarly, Bxpc3 (c), H446 (d), and Ecs9706 (e) cells also formed spheres in suspension culture after 4 days induction. Scale bars, 100 μm. (C) Differentiation of induced tumorsphere cells. Induced panc1 sphere cells were cultured in suspension for 5 days. Cells were then digested into single cells and cultured in DMEM containing 10% FBS for 3 days. These cells restored their original morphology (upper panel) as parental panc1 cells (lower panel).
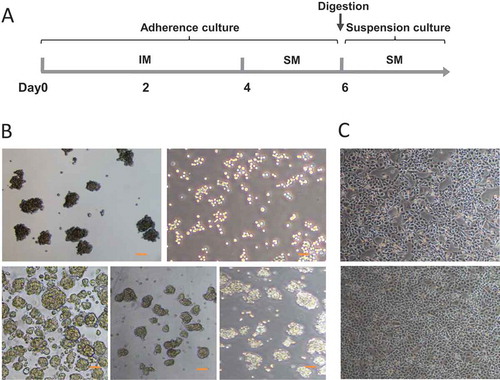
Figure 3. (A) Flow cytometry analysis of CD44, CD24, ESA and CD133 in Panc1 adherent cells and induced sphere cells. FSC vs SSC gating strategy was first used to exclude the dead cells and debris. The histogram displays the fluorescence intensity (MFI) of the live cells of different groups.* P < 0.05. (B) Increased expression of Oct4 and Nanog in Panc1 sphere cells compared to the adherent parental cells. Panc1 sphere cells were digested to individual cells and transferred to matrigel-coated dishes. 24 hrs later, cells were used for immunoflurescence staining. DNA was counterstained by DAPI. Scale bar, 10 μm. The histogram displays the percentage of positive cells. *: P < 0.05 (C) mRNA levels of indicated genes were evaluated by RT-PCR. A: Panc1 adherent cells; S: Panc1 induced sphere cells.
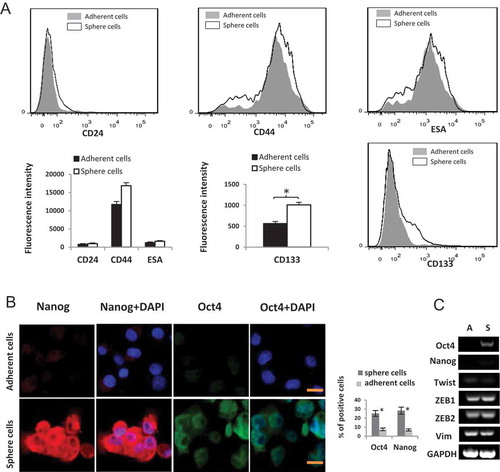
Figure 4. (A) Drug sensitivity. After exposure to gemcitabine and 5-FU (20, 100 μg/ml) for 3 days, cell viability was significantly higher in Panc1 induced sphere cells than in adherent cells. (B) Exclusion of Hoechst 33,342. Cells were incubated with Hoechst 33,342 (blue) and PI (red). The Hoechst 33,342 staining of Panc1 sphere cells was remarkably weaker than that of Panc1 adherent cells. PI staining labeled apoptotic cells. (C) Cell proliferation. The proliferation rate of Panc1 induced sphere cells was significantly lower than that of Panc1 adherent cells.
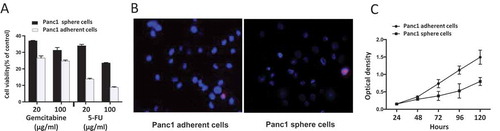
Figure 5. Tumorigenicity in vivo. 1 × 10³ cells were injected subcutaneously into both flanks of the nude mice (n = 5/group). Panc1 adherent cells were injected on the left (L), and the induced sphere cells were injected on the right (R). After 8 weeks, the mice were euthanized and the tumors were removed and measured.
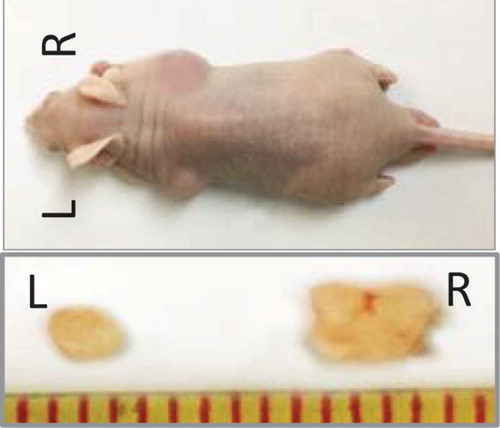
Table 1. Primers for RT-PCR.
Table 2. Tumorigenicity in vivo.