Figures & data
Figure 1. Schematic representation of the in vivo experiments conducted. Specifically, ChREBP wild-type (ChREBPWT) and knockout (ChREBPKO) mice were transfected with a myristoylated/activated form of AKT1 (myr-AKT1), either alone (a) or in association with c-Met (b) or an oncogenic form of NRas (NRasV12; c), via hydrodynamic gene delivery. ChREBPWT were also injected with the empty vector (control). Mouse were monitored daily by abdominal palpation and sacrificed when palpable masses were appreciable. The number of mice used for the experiments is indicated. Abbreviation: w.p.i., weeks post injection.
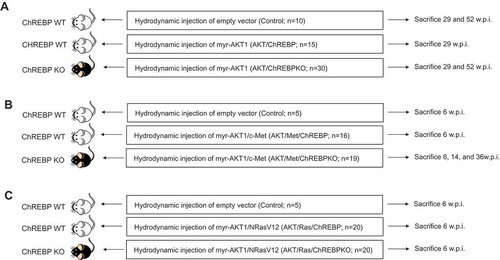
Figure 2. Genetic depletion of ChREBP strongly delays hepatocarcinogenesis driven by AKT overexpression in the mouse. (a) Overexpression of myr-AKT1 promoted the development of multiple liver tumors by 29 weeks post hydrodynamic injection in ChREBP WT mice (indicated as AKT/ChREBP). Macroscopically, livers of AKT/ChREBP mice were enlarged, pale, and characterized by the presence of numerous nodules occupying the whole surface. Microscopically, the liver parenchyma of AKT/ChREBP mice was occupied by large hepatocellular tumors containing areas of necrosis (N). Importantly, tumors displayed a homogeneous immunoreactivity for HA-tagged AKT (insets), implying their origin from hydrodynamically transfected cells. (a; lower panel). (b) In striking contrast, overexpression of AKT in ChREBP KO mice (indicated as AKT/ChREBPKO) resulted in delayed hepatocarcinogenesis at the same time point. Livers of AKT/ChREBKO mice appeared normal macroscopically and displayed the presence of isolated or small clusters of altered cells at the microscopic level. As expected, the scattered altered hepatocytes exhibited immunolabeling for HA-Tagged AKT (inset). (c; left panels). Fifty-two weeks after hydrodynamic injection, a large fraction of AKT/ChREBPKO liver parenchyma was occupied by altered hepatocytes, characterized by a strikingly enlarged cytoplasm. (c; right panels). Furthermore, the liver of three of fifteen (20%) AKT/ChREBPKO mice displayed the presence of tumor nodules macroscopically appreciable (indicated by arrow). Microscopically, the nodular lesions consisted of clear-cell hepatocellular carcinomas. Original magnifications: 40x and 100x. Scale bar: 500µm for 40x, 100µm for 100x. Abbreviations: HE, hematoxylin and eosin; w.p.i., weeks post injection.
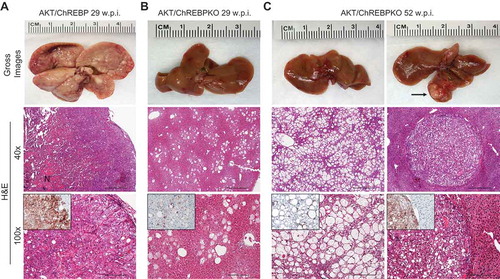
Figure 3. Effect of ChREBP gene knockout on body, liver, and metabolic parameters in mice subjected to AKT overexpression by hydrodynamic gene transfer. Control (injected with empty vector; n = 10) and AKT/ChREBP mice (n = 15) were sacrificed 29 weeks post injection (w.p.i.). AKT/ChREBPKO mice (n = 15 for each group) were sacrificed at two distinct time points: 29 w.p.i. (indicated as AKT/ChREBPKO I) and 52 w.p.i. (AKT/ChREBPKO II), respectively. Tukey–Kramer test: P < 0.001 a, vs control; b, vs AKT/ChREBP; c, vs AKT/ChREBPKO I mice. Abbreviations: FA, fatty acids; ENO, enolase activity; G6PDH, glucose 6-phosphate dehydrogenase activity; LDH, lactate dehydrogenase activity; TG, triglycerides.
Figure 4. Depletion of ChREBP results in decreased proliferation rate of AKT-overexpressing lesions. AKT/ChREBP mice (n = 15) were sacrificed 29 weeks post injection (w.p.i.). AKT/ChREBPKO mice (n = 15 for each group) were sacrificed at two distinct time points: 29 w.p.i. (indicated as AKT/ChREBPKO I) and 52 w.p.i. (AKT/ChREBPKO II), respectively. (a) Differences in proliferation indices (as assessed by Ki67 index) between controls (injected with empty vector), AKT/ChREBP, AKT/ChREBPKO I, and AKT/ChREBPKO II mice. (b–d). Differences in the mRNA levels of proliferation promoting genes (Plk1, Skp2, and Foxm1; as determined by quantitative real-time RT-PCR) in the same mouse cohorts. Quantitative values for Plk1, Skp2, and Foxm1 mRNA were calculated by using the PE Biosystems Analysis software and expressed as Number target (NT). NT = 2−ΔCt, wherein ΔCt value of each sample was calculated by subtracting the average Ct value of the target gene from the average Ct value of the β-Actin gene (housekeeping gene). Tukey–Kramer test: P < 0.0005 a, vs control (mice injected with empty vector); b, vs AKT/ChREBP; c, vs AKT/ChREBPKO I mice. (e) Large AKT/ChREBP HCC (T) characterized by very high rate of proliferation. (f) Low proliferative activity in an AKT/ChREBPKO II HCC (T). The striking differences in proliferation degree can be better appreciated in insets. HCC are demarcated from the surrounding non-tumorous tissue with dotted lines. Original magnifications: 40x and 100x in the large pictures, 400x in insets. Scale bar: 500µm for 40x, 100µm for 100x. Abbreviations: HE, hematoxylin and eosin staining; T, tumor (HCC).
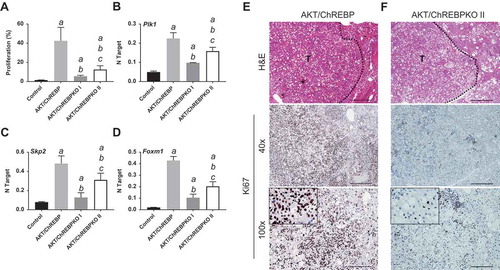
Figure 5. Genetic depletion of ChREBP abolishes AKT/Met-driven hepatocarcinogenesis in mice. (a) Overexpression of myr-AKT1 and c-Met protooncogenes promoted the development of multiple liver tumors within 6 weeks post hydrodynamic injection (w.p.i) in mice with wild-type ChREBP gene (indicated as AKT/Met/ChREBP). Macroscopically (gross images), livers of AKT/Met/ChREBP mice appeared pale, enlarged, and characterized by the presence of numerous nodules. Microscopically, the liver parenchyma of AKT/Met/ChREBP mice was occupied by numerous hepatocellular tumors (T) composed by clear cell neoplastic hepatocytes with an enlarged, clear cytoplasm due to lipid accumulation. (b) Remarkably, hepatocarcinogenesis was completely suppressed when overexpression of AKT/c-Met was conducted in CHREBP KO mice (indicated as AKT/Met/ChREBPKO). Indeed, livers of AKT/Met/ChREBPKO mice were normal both macroscopically and microscopically, indistinguishable from control livers also in terms of body (c) and liver (d) weight and, consequently, liver/body weight ratio (e). Original magnifications: 40x and 100x. Scale bar: 500µm for 40x, 100µm for 100x. Tukey–Kramer test: P < 0.0001 a, vs control (mice injected with empty vector); b, vs AKT/Met/ChREBP mice. Abbreviation: H&E, hematoxylin and eosin.
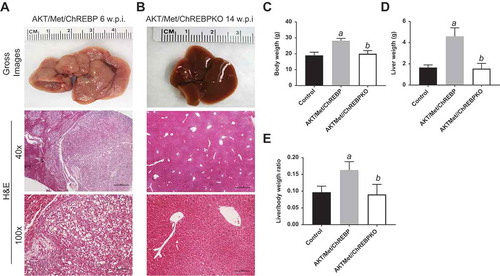
Figure 6. Genetic ablation of ChREBP in the mouse liver does not affect tumor development driven by AKT/Ras co-expression. (a,b) Overexpression of AKT/Ras triggered the development of multiple hepatocellular carcinomas and cholangiocarcinomas both in ChREBP WT (AKT/Ras/ChREBP; n = 20) and ChREBP KO (AKT/Ras/ChREBPKO; n = 20) mice. Tumors in the two mouse cohorts developed with the same latency and were indistinguishable histopathologically (a,b) as well as in body weight (c), liver weight (d), and liver/body weight ratio (e). Original magnifications: 40x and 100x. Scale bar: 500µm for 40x, 100µm for 100x. Abbreviations: HE, hematoxylin and eosin staining; w.p.i, weeks post injection. Tukey–Kramer test: P < 0.0001 a, vs control (mice injected with empty vector).
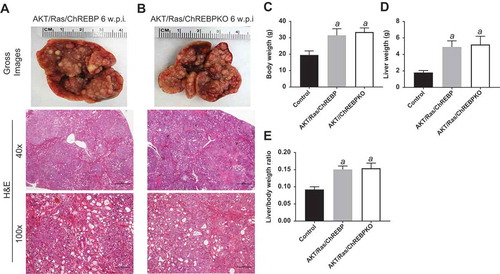
Figure 7. Suppression of ChREBP gene by specific siRNA for 48h induces downregulation of FASN and SCD1 targets, without effect on phosphorylated ERK1/2 proteins in the AKT/Ras mouse HCC cell line. (a) Effects on the levels of the selected proteins (as assessed by Western blot analysis) are shown. β-Actin was used as a loading control. (b,c) Knockdown of ChREBP in association with the MEK inhibitor U0126 for 48h triggers downregulation of proliferation and induction of apoptosis. Cell proliferation was analyzed using the BrdU Cell Proliferation Assay Kit (Cell Signaling Technology Inc.). Apoptosis was assessed with the Cell Death Detection Elisa Plus Kit (Roche Molecular Biochemicals). (d–f) Combined administration of ChREBP siRNA and U0126 synergistically downregulates glycolysis (as assessed by LDH activity; E) and the pentose phosphate shunt (as determined by glucose 6-phosphate dehydrogenase activity; F), but only ChREBP silencing negatively affects fatty acid synthesis (D). Fatty acid synthesis was measured in AKT/Ras HCC cells by incorporation of [U-[Citation14]C]acetate into lipids as described [Citation13]. Specifically, AKT/Ras cells were cultured in 96-well plates at 2.0 x 10[Citation3]/well and incubated overnight. After the addition of specific siRNAs, vehicle, or inhibitors as indicated, cells were pulse-labelled with [U-[Citation14]C]acetate, 1 μCi/well for 48 hours. Lipids were Folch extracted and counted for [Citation14]C. Experiments were conducted three times in triplicate. Tukey–Kramer test: at least P < 0.001 a, vs scrambled siRNA; b, vs DMSO (solvent); c, vs U0126; d, vs ChREBP siRNA. Abbreviations: FA, fatty acids; U0, U0126.
![Figure 7. Suppression of ChREBP gene by specific siRNA for 48h induces downregulation of FASN and SCD1 targets, without effect on phosphorylated ERK1/2 proteins in the AKT/Ras mouse HCC cell line. (a) Effects on the levels of the selected proteins (as assessed by Western blot analysis) are shown. β-Actin was used as a loading control. (b,c) Knockdown of ChREBP in association with the MEK inhibitor U0126 for 48h triggers downregulation of proliferation and induction of apoptosis. Cell proliferation was analyzed using the BrdU Cell Proliferation Assay Kit (Cell Signaling Technology Inc.). Apoptosis was assessed with the Cell Death Detection Elisa Plus Kit (Roche Molecular Biochemicals). (d–f) Combined administration of ChREBP siRNA and U0126 synergistically downregulates glycolysis (as assessed by LDH activity; E) and the pentose phosphate shunt (as determined by glucose 6-phosphate dehydrogenase activity; F), but only ChREBP silencing negatively affects fatty acid synthesis (D). Fatty acid synthesis was measured in AKT/Ras HCC cells by incorporation of [U-[Citation14]C]acetate into lipids as described [Citation13]. Specifically, AKT/Ras cells were cultured in 96-well plates at 2.0 x 10[Citation3]/well and incubated overnight. After the addition of specific siRNAs, vehicle, or inhibitors as indicated, cells were pulse-labelled with [U-[Citation14]C]acetate, 1 μCi/well for 48 hours. Lipids were Folch extracted and counted for [Citation14]C. Experiments were conducted three times in triplicate. Tukey–Kramer test: at least P < 0.001 a, vs scrambled siRNA; b, vs DMSO (solvent); c, vs U0126; d, vs ChREBP siRNA. Abbreviations: FA, fatty acids; U0, U0126.](/cms/asset/80e227b1-93a1-4636-9538-b18544a8d8d6/kccy_a_1489182_f0007_b.gif)
Figure 8. Chrebp silencing by specific siRNA for 48h induces downregulation of Fasn and Scd1 targets and cooperates with the MEK inhibitor U0126 to downregulated Plk1, Skp2, and Foxm1 genes (as determined by quantitative real-time RT-PCR) in the AKT/Ras mouse HCC cell line. Quantitative values for Chrebp, Fasn, Scd1, Plk1, Skp2, and Foxm1 mRNA levels were calculated by using the PE Biosystems Analysis software and expressed as Number target (NT). NT = 2−ΔCt, wherein ΔCt value of each sample was calculated by subtracting the average Ct value of the target gene from the average Ct value of the β-Actin gene (housekeeping gene). Experiments were conducted three times in triplicate. Tukey–Kramer test: at least P < 0.001 a, vs scrambled siRNA; b, vs DMSO (solvent); c, vs U0126; d, vs ChREBP siRNA.
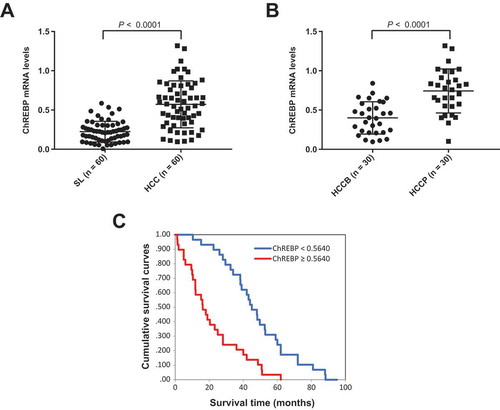
Figure 9. ChREBP is overexpressed in human hepatocellular carcinoma (HCC). (a) Levels of ChREBP mRNA were significantly more elevated in HCC (n = 60) than corresponding non-tumorous surrounding livers (SL; n = 60), as detected by quantitative reverse-transcription PCR. Number target (NT) = 2−ΔCt, wherein ΔCt value of each sample was calculated by subtracting the average Ct value of the ChREBP gene from the average Ct value of the β-actin gene. Mann–Whitney test: a, vs SL, P < 0.0001. (b) Levels of ChREBP mRNA are significantly higher in HCC with poorer outcome (HCCP) than in tumors with better prognosis (HCCB). Mann–Whitney test: a, vs HCCB, P < 0.0001. (c) Kaplan–Meier survival curves of human HCC with high and low ChREBP mRNA levels, showing the unfavorable outcome of patients with high ChREBP mRNA expression.