
Figures & data
Figure 1. Pre-senescent fibroblasts are under replication stress. (a) Scheme of induced cellular senescence by serial passaging. Pre-senescent cells (two passages before RS) were analyzed. B-C DNA combing from asynchronous cells successively labeled with IdU (red) and with CldU (green) of proliferative (b) and pre-senescent (c) IMR90 fibroblasts. DNA fibers are shown in blue. (d) Inter-Origin Distance and fork velocity are significantly decreased in pre-senescent IMR90 fibroblasts. (e-g) Mapping short nascent strands (SNSs) by DNA sequencing detected fewer origins peaks (e), a decreased size of initiation zones (f) and increased number of regions without detectable origins (g)
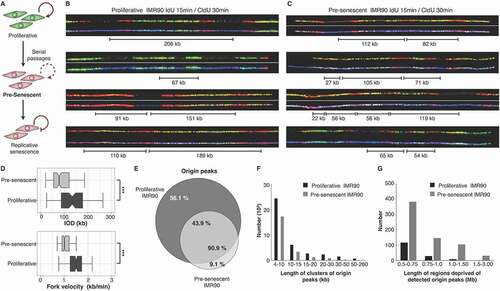
Figure 2. The RT program is maintained upon entry to cellular senescence. (a) Scheme of the induced replicative senescence by serial passaging or oncogene hyper-activation (OIS). Pre-senescent cells (two passages before RSfor serial passaging or 48 hours after induction of Ras) were analyzed. (b) Correlation matrix of genome-wide RT program from proliferative and pre-senescent fibroblasts of distinct age donors (fetal IMR90, neonatal BJ and aged 74 yr). (c-f). RT profiles of representative chromosome segments of proliferative and pre-senescent cells from: fetal fibroblasts (c), neonatal cells (d) and fibroblasts of 74 yr old donor (e), and oncogene hyper-activated fibroblasts (f)
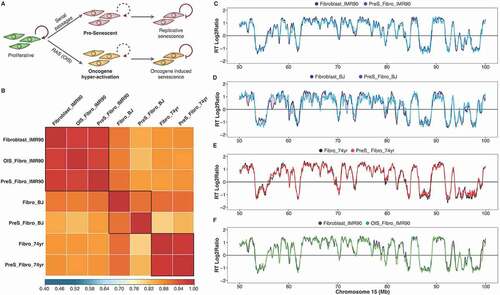
Figure 3. RT changes upon entry to cellular senescence. (a) Overlap analysis of significant RT variable regions identifying a unique region that changes upon entry to cellular senescence in all primary cells analyzed (OIS_IMR90 shown in red, PreS_IMR90 shown in yellow, PreS_BJ shown in green, PreS_Fibro74yrs shown in blue). (b) RT profiles of proliferative and pre-senescent cells from fetal fibroblasts (IMR90), from neonatal cells (BJ) and from fibroblasts of a 74 year-old donor, centered at the unique region that switches from early to late replication in pre-senescent cells. This locus is on chromosome 7 and contains the CREB5 gene. (c) Expression levels of CREB5 in normal (IMR90), senescent (OIS_ IMR90) and a senescence bypass model (IMR90_OIS_bypass). Transcription data are from [Citation46]
![Figure 3. RT changes upon entry to cellular senescence. (a) Overlap analysis of significant RT variable regions identifying a unique region that changes upon entry to cellular senescence in all primary cells analyzed (OIS_IMR90 shown in red, PreS_IMR90 shown in yellow, PreS_BJ shown in green, PreS_Fibro74yrs shown in blue). (b) RT profiles of proliferative and pre-senescent cells from fetal fibroblasts (IMR90), from neonatal cells (BJ) and from fibroblasts of a 74 year-old donor, centered at the unique region that switches from early to late replication in pre-senescent cells. This locus is on chromosome 7 and contains the CREB5 gene. (c) Expression levels of CREB5 in normal (IMR90), senescent (OIS_ IMR90) and a senescence bypass model (IMR90_OIS_bypass). Transcription data are from [Citation46]](/cms/asset/3115b0c6-b582-4532-9887-1263ef4a7b3d/kccy_a_1491235_f0003_oc.jpg)
Figure 4. RT alterations in physiological and premature aging are not linked to cellular senescence. (a) Schematic depiction of the distinct cell samples analyzed: fibroblasts from distinct-age donors and from HGPS patients. (b) Correlation matrix of genome-wide RT programs from human ES cell lines (ESC_BG01, ESC_BG02, ESC_H1, ESC_H7, ESC_H9) and fibroblasts of distinct-age donors (Fibro IMR90, post-natal BJ, 74 yr, 92 yr and 96 yr) and HGPS patients (Prog_2yr, Prog_8yr_A and Prog_8yr_B). (c-f) RT profiles of a representative chromosome segment comparing normal IMR90 fibroblasts with HGPS cells (c); normal IMR90 fibroblasts with fibroblasts of distinct age donors (D); proliferative and pre-senescent cells from fetal fibroblasts (e); and proliferative and pre-senescent cells from fibroblasts of 74 yr old donor (f). (g) Overlap between the RT changes observed in HGPS, natural aging and cellular senescence. (h) Percentage of changes from early to late replication (EtoL) or late to early (LtoE) in HGPS and natural aging
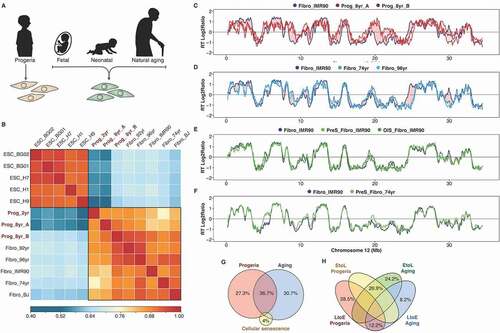
Figure 5. RT signatures of aging and HGPS. (a) Hierarchical and k-means clustering of RT variable regions between proliferative fibroblasts from distinct age donors (Fibro IMR90, post-natal BJ, 74 yr, 92yr and 96 yr), pre-senescent fibroblasts (preS IMR90, OIS IMR90, pre-senescent BJ, preS 74 yr) and HGPS fibroblasts (Prog_2yr, Prog_8yr_A and Prog_8yr_(b). The heat map shows the RT ratios [= log2(Early/Late)]. Branches of the dendrogram were constructed based on the correlation values between distinct samples (distance = correlation value – 1). k-means clustering of switching segments define RT signatures of segments that were replicated differentially among the samples (labelled in grey boxes). Sex chromosomes were removed from the analysis to discard gender differences. B) RT values of the distinct genomic regions of each RT signature and significant differences are shown (*p-value < 2 x 10⁻¹⁶). (c) RT profiles at representative genomic regions of each RT signature. Significant changes are highlighted by grey boxes. (d) Ontology analysis of the distinct RT signatures. Analysis was performed with the Genomic Regions Enrichment of Annotations Tool [Citation74]. Statistical significance is shown at the bottom (p values measured by binomial test)
![Figure 5. RT signatures of aging and HGPS. (a) Hierarchical and k-means clustering of RT variable regions between proliferative fibroblasts from distinct age donors (Fibro IMR90, post-natal BJ, 74 yr, 92yr and 96 yr), pre-senescent fibroblasts (preS IMR90, OIS IMR90, pre-senescent BJ, preS 74 yr) and HGPS fibroblasts (Prog_2yr, Prog_8yr_A and Prog_8yr_(b). The heat map shows the RT ratios [= log2(Early/Late)]. Branches of the dendrogram were constructed based on the correlation values between distinct samples (distance = correlation value – 1). k-means clustering of switching segments define RT signatures of segments that were replicated differentially among the samples (labelled in grey boxes). Sex chromosomes were removed from the analysis to discard gender differences. B) RT values of the distinct genomic regions of each RT signature and significant differences are shown (*p-value < 2 x 10⁻¹⁶). (c) RT profiles at representative genomic regions of each RT signature. Significant changes are highlighted by grey boxes. (d) Ontology analysis of the distinct RT signatures. Analysis was performed with the Genomic Regions Enrichment of Annotations Tool [Citation74]. Statistical significance is shown at the bottom (p values measured by binomial test)](/cms/asset/9a467ab3-df2e-4cfd-9db3-a4e530978cf8/kccy_a_1491235_f0005_oc.jpg)
Figure 6. Early to late RT changes occur at lamin-associated domains (LADs). (a) Scatterplot of RT and distance to IMR90 LADs. (b) Distribution of genomic regions with respect to IMR90 LADs. (c) Histogram of distances to the nearest LADs of regions from distinct RT signatures. The Sequential Monte Carlo multiple testing (MCFDR) algorithm [Citation75] was applied to test whether the regions from each RT signature are closer than expected by chance to the LADs (p-values are shown). IMR90 LADs were obtained from [Citation69]
![Figure 6. Early to late RT changes occur at lamin-associated domains (LADs). (a) Scatterplot of RT and distance to IMR90 LADs. (b) Distribution of genomic regions with respect to IMR90 LADs. (c) Histogram of distances to the nearest LADs of regions from distinct RT signatures. The Sequential Monte Carlo multiple testing (MCFDR) algorithm [Citation75] was applied to test whether the regions from each RT signature are closer than expected by chance to the LADs (p-values are shown). IMR90 LADs were obtained from [Citation69]](/cms/asset/72a8fc49-ca44-4a99-96ed-698ff4c9d745/kccy_a_1491235_f0006_oc.jpg)