Figures & data
Figure 1. Comparison of mRNAs expression levels for cyclins in synchronous hPSCs, NP and HF. (a) Human fibroblasts (HF), hiPSCs (FN2.1), hESCs (H9) and NP derived from H9 cells were arrested in G1 with PD0332991 (PD) (48 h 1 μM for HF, 30 h 5 μM for hPSC and 24 h 1 μM for NP) and in G2/M with Nocodazole (NOCO) (72 h 200 ng/ml for HF, 24 h 100 ng/ml for hPSC and 54 h 200 ng/ml for NP). Cell cycle profile of asynchronous and pharmacologically arrested cells was analyzed after cells were fixed with cold 70% ethanol. DNA content was measured with propidium iodide (PI) and its fluorescence was determined with a flow cytometer. A representative DNA content frequency histogram plot is shown for each condition. The percentage of cells in each cell cycle phase was calculated by the FlowJo v10.0.7’s univariate platform. N = 3. (b) Heat maps representing mRNA expression levels quantified by RT-qPCR of cyclins D1, D2, D3, E1, A2 and B1 in HF, FN2.1, H9 and NP cells arrested with in G1 with PD or in G2/M with NOCO following the same experimental conditions described in (a). rpl7 expression was used as normalizer. The mRNA fold induction is relative to HF control cells (synchronous cells) arbitrarily set as 1. N = 5. Results are shown as a heat map generated with the software CIMminer.
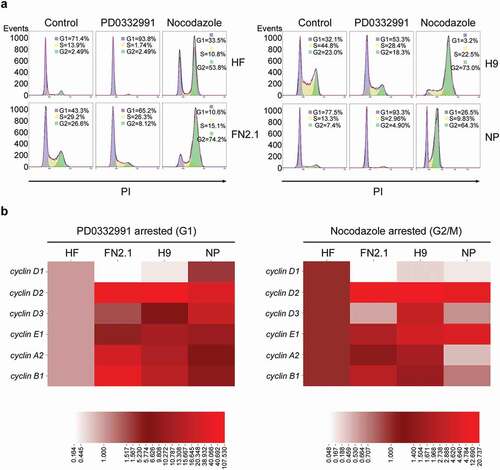
Figure 2. Comparison of protein expression levels for cyclins in asynchronously proliferating and G1 arrested hPSCs, NP and HF cells. Expression levels of cyclins D1, D2, E1, A and B1 were analyzed by Western blot in HF, FN2.1 (hiPSCs), H9 (hESCs) and NP cells asynchronously growing (Asynchronous) (a) or arrested in G1 with PD0332991 (PD) (1 µΜ for 48 h for HF, 5 μM for 30h for hPSCs and 1 μM for 24h for NP) (b). Actin was used as loading control. Mean + SEM fold induction relative to HF and representative blots of three independent experiments are shown. (*) p < 0.05, (**) p < 0.01 and (***) p < 0.001 vs. HF; (&) p < 0.05, (&&) p < 0.01 and (&&&) p < 0.001 vs. H9.
Figure 3. Changes in cyclins mRNA expression levels throughout hPSCs, NP and HF cell cycle progression. Analysis of mRNA expression level changes of cyclins A2, B1, D1, D2, D3 and E1 quantified by RT-qPCR in asynchronous or synchronous G1 (PD arrested) or G2/M (NOCO arrested) HF, FN2.1, H9 and NP cells. rpl7 expression was used as normalizer. Graphs show mean + SEM mRNA fold induction relative to asynchronous control cells, arbitrarily set as 1. N = 5, (*) p < 0.05, (**) p < 0.01 and (***) p < 0.001 vs. Control (asynchronous cells).
Figure 4. Changes in cyclin E1 mRNA expression level throughout hPSCs (grown in defined medium) cell cycle progression and in asynchronous cells after PI3K/AKT, MEK/ERK, c-Myc and E2Fs inhibition. Analysis of mRNA expression levels of cyclin E1 quantified by RT-qPCR in: (a) asynchronous or synchronous G1 (PD arrested, 5μM for 30h) or G2/M (NOCO arrested, 100 ng/ml for 24 h) FN2.1 and H9 hPSCs grown and maintained in fully defined conditions (Vitronectin coated dishes and E8 medium); (b) asynchronous FN2.1 and H9 hPSCs grown with E8 medium at 24 hours post AKT, MEK1/2 and c-Myc inhibition with GSK690693 (10 µM), U0126 (20 µM) and 10,058-F4 (100 µM), respectively; and (c) asynchronous FN2.1 and H9 hPSCs grown with E8 medium during 7 days in the presence of the pan-E2Fs inhibitor HLM006474 (40 µM). rpl7 expression was used as normalizer in all cases. Graphs show mean + SEM mRNA fold induction relative to asynchronous or Vehicle (DMSO treated) control cells (arbitrarily set as 1) of at least three independent experiments. (*) p < 0.05, (**) p < 0.01 and (***) p < 0.001 vs. Control or Vehicle.
Figure 5. Regulation of cyclin E1 mRNA expression levels in G1/S boundary. (a) hiPSCs (FN2.1), hESCs (H9) (both grown with E8 medium) and NP derived from H9 cells were arrested in G1/S boundary with Aphidicolin (10 μg/ml for 20 h hPSCs and 10μg/ml for 48h for NP). Cell cycle profile of asynchronous and pharmacologically arrested cells was analyzed after cells were fixed with cold 70% ethanol. DNA content was measured with propidium iodide (PI) and its fluorescence was determined with a flow cytometer. A representative DNA content frequency histogram plot is shown for each condition. The percentage of cells in each cell cycle phase was calculated by the FlowJo v10.0.7’s univariate platform. N = 3. (b) Analysis of mRNA expression levels of cyclin E1 quantified by RT-qPCR in asynchronous or synchronous G1/S (Aphidicolin) FN2.1 and H9 hPSCs (both grown and maintained in Vitronectin coated dishes and E8 medium) and NP. rpl7 expression was used as normalizer. Graphs show mean + SEM mRNA fold induction relative to asynchronous control cells (arbitrarily set as 1) of at least three independent experiments. (*) p < 0.05 and (***) p < 0.001 vs. Control (asynchronous cells).
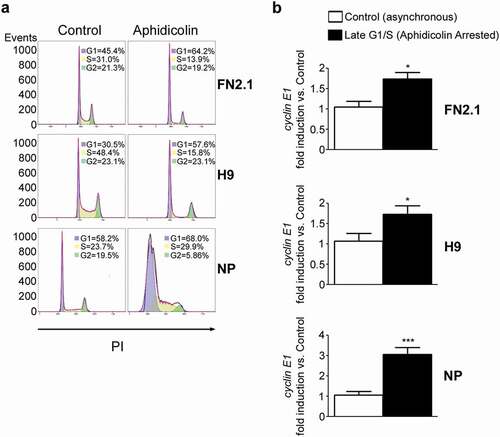
Figure 6. Changes in cyclin E1 protein expression levels throughout hPSCs and NP cell cycle progression. Analysis of cyclin E1 protein expression levels quantified by Western blot in asynchronous (Control) or synchronous G1 (PD arrested, 5 μM for 30 h for hPSCs and 1 μM for 24 h for NP) (a, b), G1/S boundary [Aphidicolin (Aph.) arrested, 10 μg/ml for 20 h for hPSCs and 10 μg/ml for 48 h for NP] (c) or G2/M [NOCO arrested, 100 ng/ml for 24 h for hPSCs and 200 ng/ml for 54 h for NP (a, b); Vincristine (Vcr.) 250 nM for 24 h for hPSCs (c)] FN2.1 and H9 hPSCs [grown in Geltrex coated dishes with CM (a) or in Vitronectin coated dishes with E8 (b, c)] and NP cells. Actin was used as loading control. Mean + SEM fold induction relative to Control (asynchronous cells, arbitrary set as 1) and representative blots of three independent experiments are shown. (*) p < 0.05, (**) p < 0.01, (***) p < 0.001 vs. Control.
![Figure 6. Changes in cyclin E1 protein expression levels throughout hPSCs and NP cell cycle progression. Analysis of cyclin E1 protein expression levels quantified by Western blot in asynchronous (Control) or synchronous G1 (PD arrested, 5 μM for 30 h for hPSCs and 1 μM for 24 h for NP) (a, b), G1/S boundary [Aphidicolin (Aph.) arrested, 10 μg/ml for 20 h for hPSCs and 10 μg/ml for 48 h for NP] (c) or G2/M [NOCO arrested, 100 ng/ml for 24 h for hPSCs and 200 ng/ml for 54 h for NP (a, b); Vincristine (Vcr.) 250 nM for 24 h for hPSCs (c)] FN2.1 and H9 hPSCs [grown in Geltrex coated dishes with CM (a) or in Vitronectin coated dishes with E8 (b, c)] and NP cells. Actin was used as loading control. Mean + SEM fold induction relative to Control (asynchronous cells, arbitrary set as 1) and representative blots of three independent experiments are shown. (*) p < 0.05, (**) p < 0.01, (***) p < 0.001 vs. Control.](/cms/asset/fc32869d-8b02-4380-abc3-06d2b2b72e67/kccy_a_1496740_f0006_b.gif)
Figure 7. Changes in cyclin E1 mRNA and protein expression levels throughout hPSCs cell cycle progression after Aphidicolin block and release. H9 hESCs and FN2.1 hiPSCs grown in Vitronectin coated dishes with E8 medium were synchronized at G1/S boundary by Aphidicolin (Aph.) block (10 μg/ml for 20 h) and released to enter the cell cycle, and then: (a) Cells were harvested at the indicated time points after release and fixed with cold 70% ethanol. DNA content was measured with propidium iodide (PI) and its fluorescence was determined with a flow cytometer to determine DNA content. A representative DNA content frequency histogram plot is shown for each time point. N = 3. Control: asynchronous cells. h: hours. (b) cyclin E1 mRNA expression levels were quantified by RT-qPCR in asynchronous or at different time points after Aphidicolin (Aph.) removal. rpl7 expression was used as normalizer. Graphs show mean + SEM mRNA fold induction relative to asynchronous control cells (arbitrarily set as 1) of at least three independent experiments. h: hours. (*) p < 0.05 and (**) p < 0.01 vs. Control (asynchronous cells). (c) cyclin E1 protein expression levels were quantified by Western blot in asynchronous or at different time points after Aphidicolin (Aph.) removal. Actin was used as loading control. Mean + SEM fold induction relative to Control (asynchronous cells, arbitrary set as 1) and representative blots of three independent experiments are shown. h: hours. (*) p < 0.05, (**) p < 0.01, (***) p < 0.001 vs. Control.
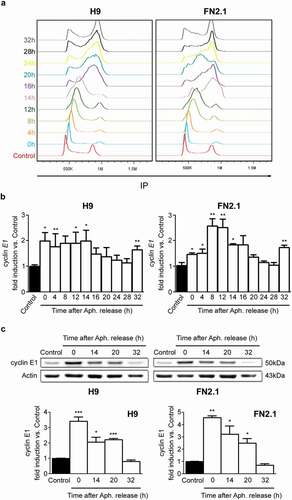
Figure 8. Regulation of cyclin E1 protein expression levels in G2/M phase. Analysis of cyclin E1 protein expression levels quantified by Western blot in asynchronous (Control) or synchronous G2/M (NOCO arrested, 100 ng/ml for 24 h for hPSCs and 200 ng/ml for 54h for NP) (a, b and c) or G1 (PD arrested, 5 μM for 30h for hPSCs and 1μM for 24 h for NP) (c) FN2.1 and H9 hPSCs (grown in Vitronectin coated dishes with E8) and NP cells treated or not with proteasome inhibitor MG-132 (MG132, 62.5 nM for 24 h for hPSCs and 62.5 nM for 54 h for NP) (a), CDK2 inhibitor II (CDK2i, 5 µM for 24 h for hPSCs and 5µM for 54 h for NP) (b) and GSK3β inhibitor CHIR99021 (CHIR, 10 µM for 24 h) (c). Actin was used as loading control. Mean + SEM fold induction relative to Control (asynchronous cells, arbitrary set as 1) and representative blots of at least three independent experiments are shown. (*) p < 0.05, (**) p < 0.01, (***) p < 0.001 vs. Control. (&) p < 0.05, (&&) p < 0.01 vs. NOCO.