Figures & data
Figure 1. LncRNA AFAP1-AS1 was upregulated in pancreatic cancer (PC) tissues and correlated with poor prognosis in PC patients. (a) Heatmap of 48 lncRNAs from two human PC microarray GEO DataSets (GSE16515 and GSE32688). (b) Relative expression levels of AFAP1-AS1 in 63 paired cancerous and peritumoral normal tissues samples. p < 0.01 vs. Normal tissue group. (c) Relative expression levels of AFAP1-AS1 in early stages of PC patients and advanced stage of PC patients. (early stages vs. advanced stages, p = 0.0119). (d) Association between AFAP1-AS1 expression level and tumor size (< 2 vs. ≥ 2 cm, p = 0.0176). (e) Relative expression level of AFAP1-AS1 in PC patients with/without lymph node metastasis. (with vs. without, p = 0.0099). (f) Kaplan-Meier analysis of overall survival time in PC patients with high and low AFAP1-AS1 levels (n = 39 and n = 24, respectively).
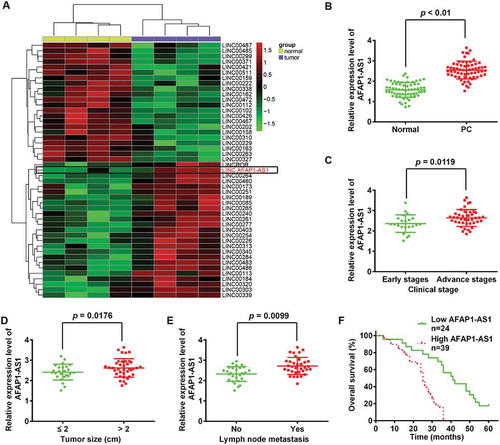
Figure 2. Knockdown of AFAP1-AS1 suppressed tumor growth in vitro and in vivo. (a) RT-PCR analysis of AFAP1-AS1 expression levels in PC cells (AsPC-1, BxPC-3, PANC-1, PaCa-2 and SW1990) and primary cultures of normal human pancreatic duct epithelial cells (HPDE6c7) used as a control. Data are represented as means ± S.D. from three independent experiments, *p < 0.05, **p < 0.01 vs. HPDE6c7. (b) qRT-PCR analysis of AFAP1-AS1 expression levels in PaCa-2 and SW1990 cells after siRNA transfection. Data are represented as the mean ± S.D. from three independent experiments, *p < 0.05, **p < 0.01 vs. si-Scramble or control. (c) The effect of AFAP1-AS1 knockdown on the proliferation of pancreatic cancer cells was determined by CCK-8 assays. Data are represented as the mean ± S.D. from three independent experiments, *p < 0.05, **p < 0.01 vs. si-Scramble. (d) The effect of AFAP1-AS1 knockdown on the cell apoptosis was measured by flow cytometry. Data are represented as the mean ± S.D. from three independent experiments, **p < 0.01 vs. si-Scramble. (e) Tumor weight changes in the mice bearing PaCa-2 and SW1990 cells with si-AFAP1-AS1 or si-Scramble. si-AFAP1-AS1 vs. si-Scramble, p < 0.01.
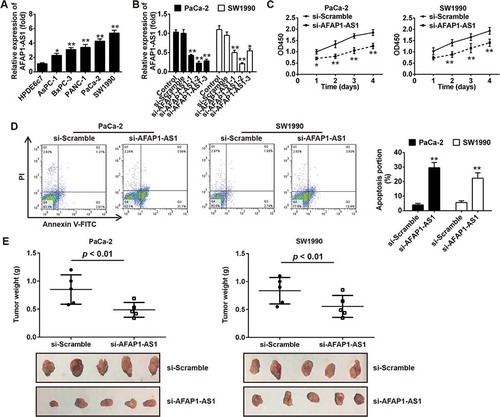
Table 1. Correlation between lncRNA AFAP1-AS1 expression and clinicopathological features of pancreatic cancer patients.
Figure 3. Knockdown of AFAP1-AS1 inhibited tumor metastasis in vitro. PaCa-2 and SW1990 cells were transfected with si-AFAP1-AS1 for 24 h, and then cells were used for further analyses. (a) Cell invasion was determined by transwell assays. (b) Cell migration was detected by wound healing assays. (c) The expressions of EMT markers including E-cadherin, N-cadherin, Vimentin and Fibronectin were measured by Western Blotting. β-actin was used as an internal loading control. Bands were quantitatively compared between groups. Data are represented as means ± S.D. from three independent experiments, **p < 0.01 vs. si-Scramble.
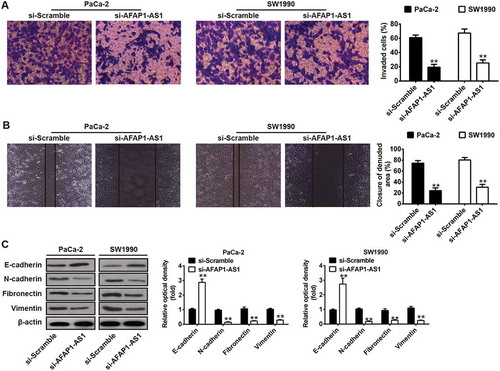
Figure 4. AFAP1-AS1 acts as a ceRNA for miR-133a in PC cells. (a) Schematic representation of the predicted target site for miR-133a in AFAP1-AS1. (b) Relative expression levels of miR-133a in 63 paired cancerous and peritumoral normal tissues. p < 0.01 vs. Normal tissue group. (c) Relative expression levels of miR-133a in pancreatic cancer cells (AsPC-1, BxPC-3, PANC-1, PaCa-2 and SW1990) and primary cultures of normal human pancreatic duct epithelial cells (HPDE6c7) used as a control. Data are represented as the mean ± S.D. from three independent experiments, *p < 0.05, **p < 0.01 vs. HPDE6c7. (d) Relative expression level of miR-133a in PaCa-2 and SW1990 cells after siRNA transfection. Data are represented as the mean ± S.D. from three independent experiments, **p < 0.01 vs. si-Scramble. (e) Relative expression level of miR-133a in PaCa-2 and SW1990 cells after Lv-AFAP1-AS1 infection. Data are represented as the mean ± S.D. from three independent experiments, **p < 0.01 vs. Lv-control. (F) The Spearman’s rank test was used to analyze the relationship between AFAP1-AS1 and miR-133a expression levels in PC tissues (r:-0.7610, p < 0.01). (g) Luciferase reporter assay in human embryonic kidney (HEK) 293T cells, co-transfected with the reporter plasmid (or the corresponding mutant reporter) and the indicated miRNAs. miR-133a mimics significantly decreased the luciferase activity in wt-AFAP1-AS1 but not in mut-AFAP1-AS1. Data are represented as means ± S.D. from three independent experiments, **p < 0.01 vs. mimics NC.
Figure 5. AFAP1-AS1 increases the expression of IGF1R by acting as a ceRNA of miR-133a. BxPC-3 cells were co-transfected with miR-133a inhibitor and si-AFAP1-AS1, while SW1990 cells were co-transfected with miR-133a mimics and Lv-AFAP1-AS1. Cells were then harvested for Western Blotting. (a) The expression of IGF1R protein was measured by Western Blotting in BxPC-3 cells after co-transfection with miR-133a inhibitor and si-AFAP1-AS1. Bands were quantitatively compared between groups. Data are represented as means ± S.D. from three independent experiments, **p < 0.01 vs. Blank group; ##p < 0.01 vs. si-AFAP1-AS1. (b) The expression of IGF1R protein was measured by Western Blotting in SW1990 cells after co-transfection with miR-133a mimics and Lv-AFAP1-AS1. Bands were quantitatively compared between groups. Data are represented as the mean ± S.D. from three independent experiments, **p < 0.01 vs. Blank group; ##p < 0.01 vs. Lv-AFAP1-AS1. (c) Relative expression level of IGF1R in 60 paired cancerous and peritumoral normal tissues. p < 0.01 vs. Normal tissue group. (D) Spearman’s analysis was used to analyze the relationship between AFAP1-AS1 and IGF1R expression levels in PC tissues (r: 0.8493, p < 0.01). (e, f) qRT-PCR and Western Blot analysis of IGF1R expression levels in PaCa-2 and SW1990 cells after siRNA transfection. Data are represented as the mean ± S.D. from three independent experiments, **p < 0.01 vs. si-Scramble. (g, j) The effect of IGF1R knockdown on cell proliferation was determined by CCK-8 assays. Data are represented as the mean ± S.D. from three independent experiments, *p < 0.05, **p < 0.01 vs. si-Scramble. (H, K) The effect of IGF1R knockdown on cell migration was assessed by wound healing assays. Data are represented as the mean ± S.D. from three independent experiments, **p < 0.01 vs. si-Scramble. (i, l) The effect of IGF1R knockdown on cell invasion was assessed by transwell assays. Data are represented as the mean ± S.D. from three independent experiments, **p < 0.01 vs. si-Scramble.
Figure 6. AFAP1-AS1 regulates miR‑133a to suppress PC cell proliferation and invasion. PaCa and SW1990 cells were co-transfected with miR-133a inhibitor and si-AFAP1-AS1. Cells were then harvested for further analyses. (a, b) Cell proliferation was determined by CCK-8 assays. (c, d) Cell apoptosis was measured by flow cytometry. (e, f) Cell migration was detected by wound healing assays. (g, h) Cell invasion was determinned by transwell assays. Data are represented as means ± S.D. from three independent experiments, *p < 0.05, **p < 0.01 vs. Blank group; ##p < 0.01 vs. si-AFAP1-AS1.
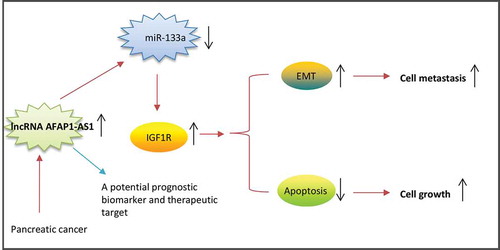
Figure 7. Schematic diagrams showing that AFAP1-AS1 is upregulated in PC tissues and cell lines, and AFAP1-AS1 acts as an oncogene by sponging miR-133a, functionally releasing IGF1R mRNA transcripts targeted by miR-133a, and activating the downstream AKT/ERK signaling pathways.