Figures & data
Table 1. Sequences of qPCR primers.
Figure 1. LPS induced macroscopic alteration in chick embryonic lungs. (A) LPS exposure significantly reduced survival rate of E18 chick embryos compared to controls. (B) The morphological appearance of embryonic chick lungs at E14, E16 and E18, and LPS induced smaller sized changes. (C) LPS exposure significantly reduced the wet and dry mass of embryos and lungs. (D) The qPCR data show LPS induced significantly up-regulated TLR4 expression at mRNA level in E18 chick lungs. *P < 0.05. **P < 0.01. Scale bar = 200μm.
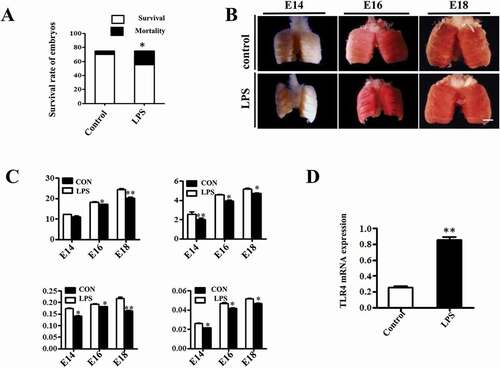
Figure 2. LPS induced microscopic alteration in chick embryonic lungs. (A, E): H&E staining was performed on transverse sections of chick lungs. The alveolar wall and gas exchange zone are indicated with arrows and line segments, respectively. LPS increased gas exchange zone thickness, and control lungs display a more mature spongy phenotype at E18. (B): The representative TEM images of E18 chick lungs shows lamellar bodies at multiple spherical particles, ranging from 500nm to 5 μm. LPS significantly reduced LB count. (C, F): PAS staining was performed on transverse sections of embryonic chick lungs. LPS induced more PAS+ areas relative to total areas in embryonic chick lungs. (D, G): In immunofluorescent staining of E18 chick lungs, red color shows AQP5 and blue color shows DAPI staining, respectively. The far right panel indicates the dotted squares with higher magnification. LPS significantly reduced AQP5+ cells in E18 chick lungs. (H): qPCR data show LPS significantly induced down-regulation of AQP5, ABCA3 and SP-C expression at mRNA level in E18 lungs. *P < 0.05. **P < 0.01 .Scale bars = 50μm.
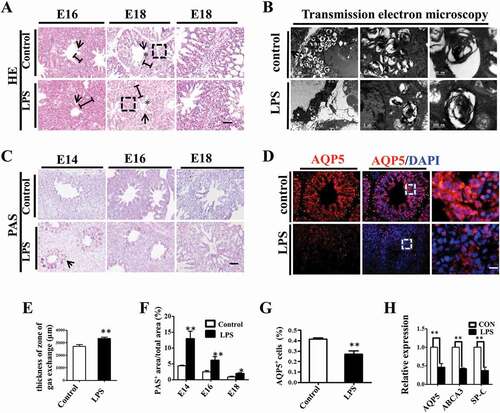
Figure 3. LPS promoted fibrosis in embryonic chick lungs. (A, D): In immunofluorescent staining of chick lungs, red color shows CAV-1 and blue color shows DAPI staining, respectively. The far right panel indicates the dotted squares of the merged images with higher magnification. LPS induced down-regulation of CAV-1 in E16 and E18 chick lungs. (B): LPS increased Masson staining in E18 chick lungs. The lower panel indicates the dotted squares with higher magnification. (C, E): In immunofluorescent staining of E18 chick lungs, red color shows Collagen I and blue color shows DAPI staining, respectively. The far right panel indicates the dotted squares of the merged images with higher magnification. LPS induced more expression of Collagen I in E18 chick lungs. (F): qPCR data show LPS-induced up-regulation of TGF-β2, TGF-β1 and Fibronectin-1 gene expression in E18 chick lungs. *P < 0.05. **P < 0.01. Scale bars = 50 μm.
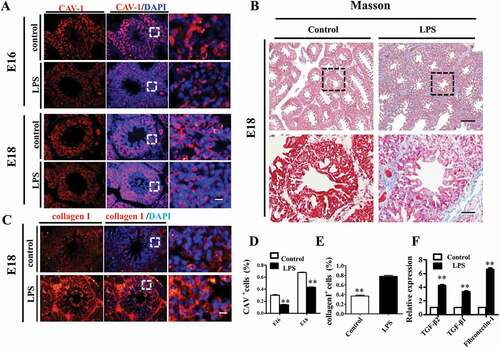
Figure 4. LPS modulated cell proliferation and apoptosis in embryonic chick lungs. (A, B, C): In immunofluorescent staining of chick lungs, red color shows PCNA, green color shows pHIS3 and blue color shows DAPI staining, respectively. The far right panel indicates the dotted squares of the merged images with higher magnification. Compared to control, PCNA and pHIS3 expression were down-regulated in E14, while up-regulated in E18 chick lungs upon LPS exposure, respectively. (D, E): TUNEL staining of E14 and E18 chick lungs, respectively. The right panels indicate the dotted squares with higher magnification. LPS reduced TUNEL+ cells in E14 and E18 chick lungs, respectively. (F): qPCR data show LPS induced up-regulation of cell cycle related gene expressions in E18 lungs. *P < 0.05. **P < 0.01. Scale bars = 50 μm.
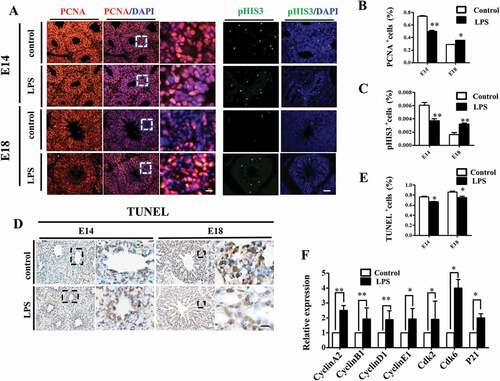
Figure 5. Oxidative stress involved in LPS-induced abnormal development of chick lungs. (A, B): In immunofluorescent staining of E18 chick lungs, red color shows Nrf2 and blue color shows DAPI staining, respectively. The far right panel indicates the dotted squares of the merged images with higher magnification. LPS induced a dramatic increase in Nrf2 expression in E18 chick lungs. (C): Flow cytometry data show intracellular ROS production in MLE-12 cells was significantly increased by LPS. (D, E): In immunofluorescent staining of MLE-12 cells, red color shows GATA-6 and blue color shows DAPI staining, respectively. LPS significantly down-regulated GATA-6 expression. (F, G): Western blot shows LPS-induced decrease in protein expression of SP-C, ABCA3 and GATA-6 in MLE-12 cells. (H): qPCR data show LPS down-regulated mRNA expression of ABCA3, SP-C and GATA-6 in MLE-12 cells. All these effects were reversed with vitamin C. *P < 0.05. **P < 0.01. Scale bars = 50 μm.
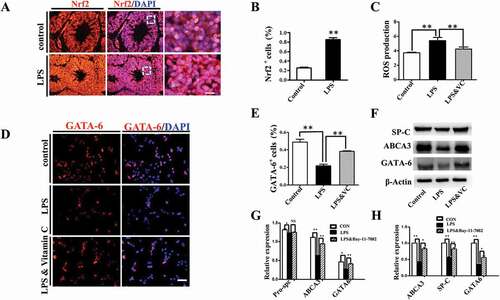
Figure 6. Activation of NF-κB pathway contributed to LPS-induced abnormal differentiation of pulmonary cells. (A): In immunofluorescent staining of MLE-12 cells, red color shows P65 and blue color shows DAPI staining, respectively. The higher magnification images are shown at right upper corners. LPS induced P65 nuclear translocation. (B, F): In immunofluorescent staining of MLE-12 cells, red color shows SP-C and blue color shows DAPI staining, respectively. LPS induced down-regulation of SP-C expression. All these effects were restored with NF-κB inhibitor Bay-11–7082. (C): qPCR data show LPS-induced expression of IL-8, IL-6 and TNF-ɑ at mRNA level in MLE-12 cells. (D, E): Western blotting shows increased protein expression of P65, phospho-P65 in MLE-12 cells upon LPS exposure. *P < 0.05. **P < 0.01. Scale bars = 50 μm.
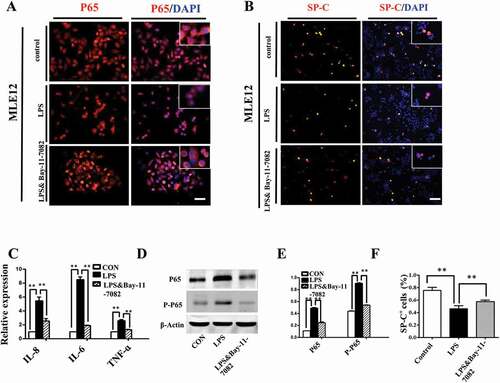
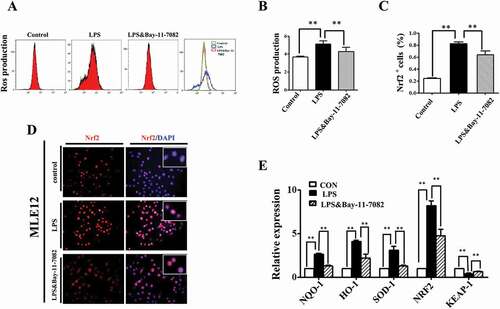
Figure 7. NF-kB signaling modulated ROS in LPS induced alveolar epithelial mal-differentiation. (A, B): Flow cytometry data and merged image show LPS-induced ROS elevation in MLE-12 cells was abolished with Bay-11–7082. (D, C): In immunofluorescent staining of MLE-12 cells, red colour stands for Nrf2 and blue colour stands for DAPI staining, respectively. The higher magnification images are shown at the right upper corners. LPS-induced increase in Nrf2 expression was partially blocked with Bay-11–7082. (E): qPCR data show LPS induced alteration of oxidative stress related genes in MLE-12 cells, which were revered with Bay-11–7083. *P < 0.05. **P < 0.01. Scale bars = 50 μm.