Figures & data
Figure 1. Differential expression of transposable elements following 5-Azacitidine treatment. (a) Differential expression of TE following senescence induced by 5-Azacitidine. The x-axis is the experimental groups, and the y-axis are the significantly dysregulated TE. (b) Differentially expressed TE biotype dysregulation following 5-Azacitidine treatment. The significantly DE TEs biotypes were identified and the modeled expression estimates are summarized for each TE transcript biotype. (c) 5-Azacitidine expected TE expression group summary. The two groups expected expression was determined by compounding the dysregulation coefficients of significantly DE TEs with the observed normalized corresponding DETE expression. The y-axis denotes the expected expression predicted by the linear model constructed in A.
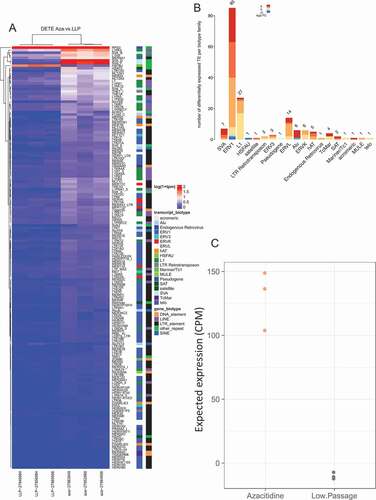
Figure 2. Transposable element overall expression of senescence induction groups. (a) Principal component analysis (PCA) of TE expression following treatment of 5-Azacitidine, Replicative senescence, oxidative (H202) treatment, and Adriamycin. (b) Relative log-expression of TE expression following treatments that induce senescence.
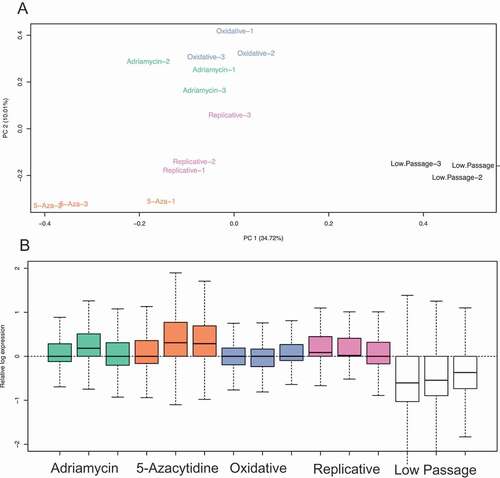
Figure 3. Differential expression of transposable elements following replicative senescence. (a) Differential expression of TE following senescence induced by replicative cell passages. Labeling is similar to ). (b) Differentially expressed TE biotype dysregulation following replicative senescence. Labeling is similar to . (c) Replicative senescent expected TE expression group summary. Labeling is similar to ).
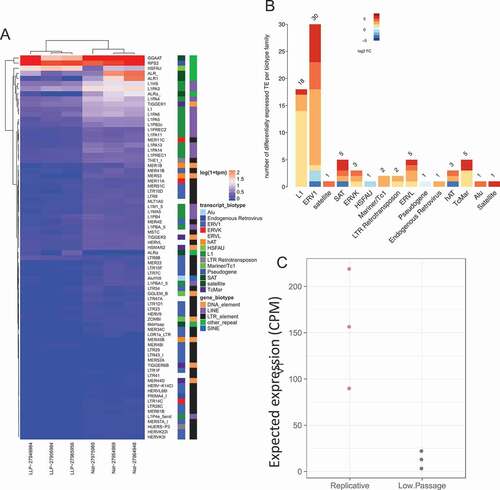
Figure 4. Differential expression of transposable elements following Adriamycin treatment. (a) Differential expression of TE following senescence induced by Adriamycin. Labeling is similar to ). (b) Differentially expressed TE biotype dysregulation following Adriamycin chemotherapy induced senescence. Labeling is similar to ). (c) Chemotherapy induced senescent expected TE expression group summary. Labeling is similar to ).
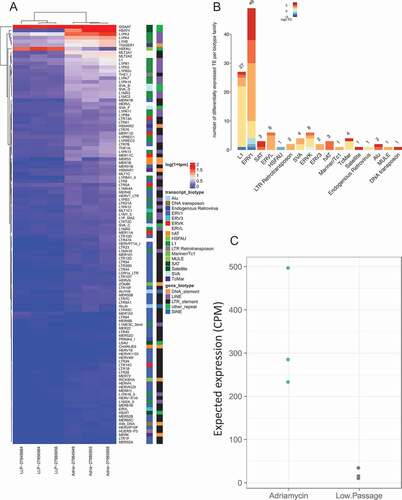
Figure 5. Differential expression of transposable elements following senescence induction by oxidative stress (H202 treatment). (a) Differential expression of TE following senescence induced by oxidative stress. Labeling is similar to ). (b) Differentially expressed TE biotype dysregulation following oxidative stress induced senescence. Labeling is similar to ). (c) Stress induced senescent expected TE expression group summary. Labeling is similar to ).
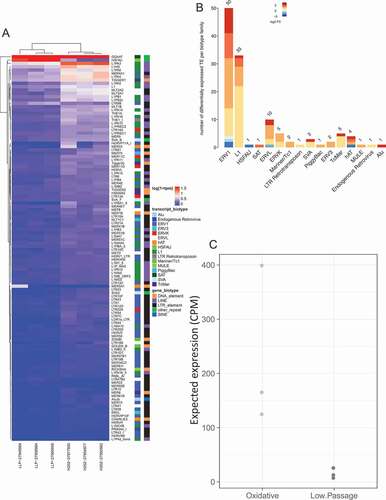
Figure 6. Senescence induced differentially expressed TE transcript per each experimental modality. (a) Set analysis of the DETE identified from the 4 modeled groups. The overlaps in the Venn Diagram indicate the number of DETE significantly dysregulated in the corresponding experimental group. (b) The differential expression of the 33 commonly TE dysregulated across all senescent modalities. The x-axis depicts the 4 experimental groups. The y-axis depicts the 33 DETE shared across groups.
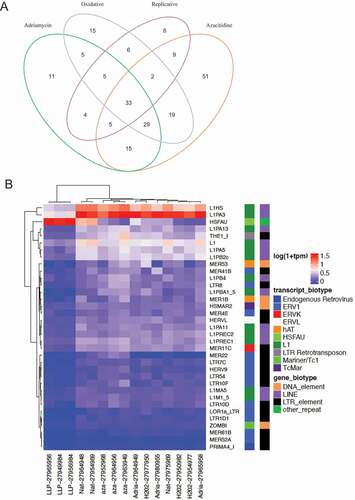
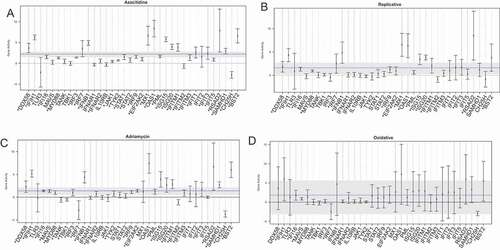
Figure 7. Viral recognition gene set analysis in senescence model. (a) Viral recognition gene pathway enrichment following 5-Azacitidine treatment. The x-axis depicts, in order, genes involved in viral recognition such as sensors, adaptors, signal transducers, transcription factors, interferon genes, and downstream interferon stimulated genes. For each gene in this pathway, there exists a 95% confidence interval also depicted. The global pathway activation is depicted as a dashed blue line, and the corresponding confidence interval is a gray solid bar. The y-axis depicts the log-fold change enrichment score. (b) Viral recognition gene pathway following replicative senescence. The x-axis and y-axis are identical to (a). (c) Viral recognition gene pathway following adriamycin chemotherapy induced senescence. The x-axis and y-axis are identical to (a). Viral recognition gene pathway following oxidative stress. The x-axis and y-axis are identical to (a).