Figures & data
Table 1. Primers for reverse transcription and qRT-PCR.
Figure 1. Increased TGFBR2 and decreased miR-3606-3p levels in SSc primary fibroblasts and dermal tissues. (a1) H&E and Masson’s staining of SSc and normal dermal tissues. (a2) Dermal thickness was calculated by measuring the distance between the dermal-epidermal junction and the derma–subcutaneous fat junction in five randomly selected fields for each skin section. (b) Arrow indicates TGFBR2-positive staining by IHC. (c1) Western blots analysis of type I collagens and TGFBR2 protein expression in six normal and six SSc patient fibroblast cells. GAPDH was used as internal control. (c2)The fold change of type I collagens and TGFBR2 protein expression was calculated by using gray scanning software. (d) qRT-PCR analysis of TGFBR2 mRNA levels in primary fibroblast cells from normal (n = 10) and SSc (n = 13) patients. The relative TGFBR2 mRNA level are expressed after normalization to GAPDH. (e) qRT-PCR analysis of relative TGFBR2 mRNA levels in 20 SSc and 21 normal skin tissues. (f) qRT-PCR analysis of relative miR-3606-3p levels in primary fibroblast cells from normal (n = 10) and SSc (n = 13) patients. Levels of miR-3606-3p are expressed as a relative index normalized to U6. (g) qRT-PCR analysis of relative miR-3606-3p in 20 SSc and 21 normal skin tissues. *P < 0.05; **P < 0.001; ***P < 0.001.
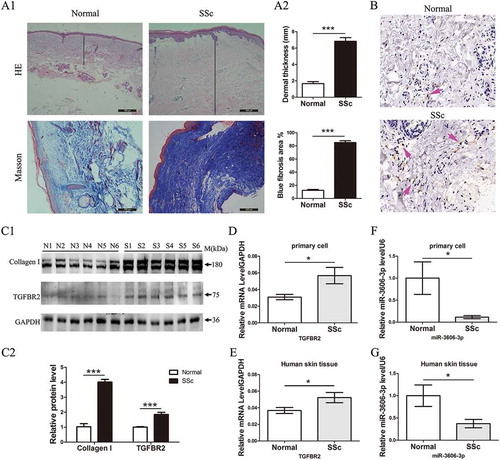
Figure 2. miR-3606-3p reduces TGFBR2 expression by directly targeting the TGFBR2 3′-UTR. (a) Schematic graph showing the subcloning of the predicted miR-3606-3p binding sites (positions site1:7258–7265, site2:7329–7335 and site3:8163–8169) of the TGFBR2 3′-UTR into the pmirGLO luciferase construct. The predicted duplex formation between miR-3606-3p and wild type binding sites is indicated. (b,c) Luciferase activities of the construct containing the wild type TGFBR2 3′-UTR reporter gene in two primary fibroblast cell types cotransfected with negative control (NC) or miR-3606-3p. Scrambled sequences were used as NC. Relative Renilla luciferase activity is determined normalization to the firefly luciferase activity. (d) The mutant miR-3606-3p binding site of TGFBR2 3′-UTR. (e) Luciferase activities of the mutant construct in two fibroblast cell types cotransfected with NC or miR-3606-3p. (f) qRT-PCR analysis of miR-3606-3p levels in the two fibroblast cell types transfected with miR-3606-3p mimics or NC for 48 h. U6 was used as internal control. (g) TGFBR2 mRNA expression in the two fibroblast cell types transfected with miR-3606-3p mimics or NC. GAPDH was used as internal control. (h-i) TGFBR2 protein levels in the two fibroblast cell types transfected with miR-3606-3p mimics or NC. All western blots assay were performed in triplicate independent experiment. The repeated bands showed in figures were represented in two individual experiment with similar experimental operation. *P < 0.05; **P < 0.01; ***P < 0.001.
Figure 3. Overexpression of miR-3606-3p or knockdown of TGFBR2 reduces collagen deposition though inhibition of the canonical SMAD-dependent TGF-β signaling in fibroblast cells. (a,b) Detection of p-SMAD2/3 and type I collagens protein levels in two fibroblast cell types overexpressing miR-3606-3p at 48 h. SMAD2/3 and GAPDH were used as loading controls. Scrambled sequences were used as NC. (c) Detection of extracellular collagens in the medium of miR-3606-3p overexpressed fibroblast cells at 48 h. Scrambled sequences were used as NC. (d,e) Detection of p-SMAD2/3 and type I collagen levels in two fibroblast cell types with TGFBR2 knockdown at 48 h. SMAD2/3 and GAPDH were used as loading controls. Scrambled sequences were used as NC. (f) Detection of extracellular collagens in the medium of TGFBR2-deficienct fibroblast cells at 48 h. Scrambled sequences were used as NC. All western blots assay were performed in triplicate independent experiment. The repeated bands showed in figures were represented in two individual experiment with similar experimental operation.*P < 0.05; **P < 0.01; ***P < 0.001.
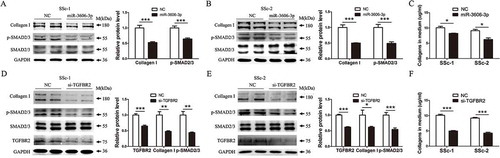
Figure 4. Overexpression of miR-3606-3p or knockdown of TGFBR2 represses fibroblasts growth. RTCA assay results of cell proliferation ability in two fibroblast cell types with overexpression of miR-3606-3p (a,b), or knockdown of TGFBR2 (c,d). Cell growth was persistently determined every 10 min for at least 60 h following miR-3606-3p transfection. Images of cell index analysis for cell proliferation in two fibroblast cell types with miR-3606-3p overexpression or TGFBR2 knockdown. Detection of p21 protein levels in the cells described in panel A-D with miR-3606-3p overexpression or TGFBR2 knockdown, NC, negative control (e-h). All western blots assay were performed in triplicate independent experiment. The repeated bands showed in figures were represented in two individual experiment with similar experimental operation.*P < 0.05; **P < 0.01; ***P < 0.001.
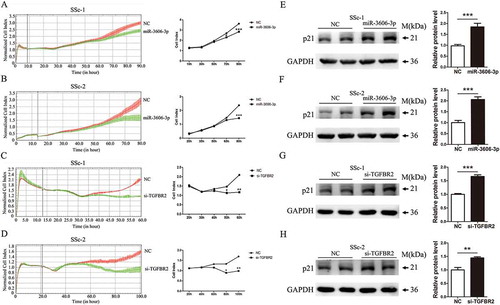
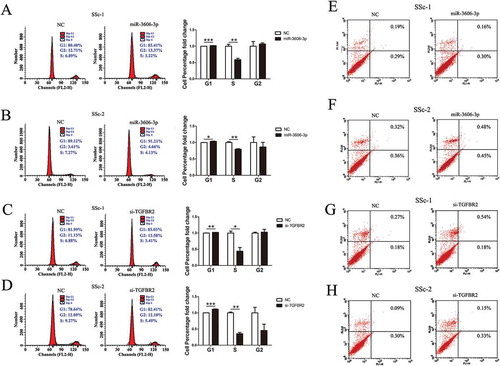
Figure 5. Overexpression of miR-3606-3p or knockdown of TGFBR2 inhibited fibroblast cell cycle, but had no effect on cell apoptosis. Flow cytometric analysis of cell cycle progression of two fibroblast cell types transfected with miR-3606-3p (a,b), or si-TGFBR2 (c,d). Cells were harvested at 72 h post-transfection and stained with propidium iodide. Shown in the right of each panel is the fold-change in percentage of different cell cycle phases. Flow cytometric analysis of apoptosis of two fibroblast cell types transfected with miR-3606-3p (e,f), or si-TGFBR2 (g,h), and non-targeting control (NC). Cells were harvested at 72 h post-transfection and stained with Annexin V/FITC and propidium iodide. *P < 0.05; **P < 0.01; ***P < 0.001.