Figures & data
Figure 1. Tyrosine 691 in Roquin2 is phosphorylated in vivo.
(a) HEK293T cells were transfected with cDNAs encoding FLAG-STREP-tagged Roquin2 (WT), Roquin2 (Y691F) or empty vector (EV). The transfected cells were treated with 100µM of pervanadate for 15 min and whole cell lysates were used for immunoblot analysis. PerV, Pervanadate. (b) Exogenous proteins were affinity-purified (AP) from cell extracts of (a) with an anti-streptavidin resin in a denatured condition. The purified complexes were, then, treated with lamda (λ)-phosphotase and probed with antibodies to the indicated proteins. PerV, Pervanadate. (c) HEK293T cells stably expressing HA-tagged KLHL6 were transfected with cDNAs encoding FLAG-tagged Roquin2 (WT) or empty vector (EV). Exogenous proteins were immunopurified from cell extracts with an anti-FLAG resin and immunocomplexes were probed with antibodies to the indicated proteins. Bottom panel shows whole cell lysates (WCL). PerV, Pervanadate. (d) Schematic representation of the sequence of the biotinylated unphosphosphorylated-Roquin2 peptides or phosphorylated-Roquin2 peptides. (e) Streptavidin pull-down assay using the indicated amount of biotinylated Roquin2 peptides incubated with FLAG-tagged in-vitro translated KLHL6 protein. Immunoblot analysis for the indicated proteins was performed using KLHL6 antibody. Affinity Purification, AP. STREP, Streptavidin.
Figure 2. PTPN14 specifically interacts with Roquin2.
(a) Biochemical purification of Roquin1 or Roquin2 protein complexes. HEK293T cells were transfected with cDNAs encoding FLAG-STREP Roquin1 (WT) or FLAG-STREP Roquin2 (WT). Proteins were immunoprecipitated (IP) with an anti-FLAG resin (α-FLAG), eluted with a FLAG peptide. 1% of samples were resolved by SDS-PAGE. The gel was stained with silver staining for protein visualization. Asterisks indicate the bait. (b) Scatter plot of identified proteins by mass spectrometry analysis of Roquin1 (WT) and Roquin2 (WT). Normalized Spectral Abundance Factors (NSAFs) were calculated for each detected protein and plotted on a log scale. X-axis represents NSAF scores distribution of all proteins detected from Roquin2 protein complexes while Y-axis represents NSAF scores distribution of all proteins detected from Roquin1 protein complexes. Red dots represent NSAF scores for the baits such as Roquin1 and Roquin2. The purple dot represents the NSAF score for PTPN14. The green and black dots represent common interactors between Roquin1 and Roquin2. (c) HEK293T cells were transfected with cDNAs encoding empty vector (EV), FLAG-STREP tagged Roquin1 or FLAG-STREP tagged Roquin2. Exogenous proteins were immunopurified from cell extracts with an anti-FLAG resin and immunocomplexes were probed with antibodies to the indicated proteins. Bottom panel shows whole cell lysates (WCL).
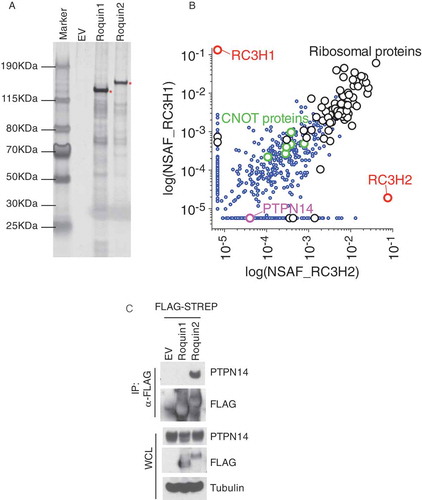
Figure 3. PTPN14 binds the C-terminal region of Roquin2 through the phosphatase domain.
(a) Left, schematic representation of Roquin2 mutants and binding to PTPN14. Roquin2 mutants that interact (+) or do not interact (-) with endogenous PTPN14 are shown. Right, immunoblot analysis of FLAG-Roquin2 immunoprecipitation (IP). HEK293T cells were transfected with constructs encoding an empty vector (EV), FLAG-tagged Roquin2 (WT) or FLAG-tagged Roquin2 deletion mutants as indicated. Immunocomplexes were probed with antibodies to the indicated proteins. STREP, Streptavidin. (b) Left, schematic representation of PTPN14 mutants and binding to Roquin2. PTPN14 mutants that interact (+) or do not interact (-) with exogenous Roquin2 are shown. Right, immunoblot analysis of FLAG-Roquin2 immunoprecipitation (IP). HEK293T cells were co-transfected with constructs encoding an empty vector (EV), V5-tagged PTPN14 (WT) or V5-tagged PTPN14 deletion mutants and FLAG-tagged Roquin2 as indicated. Immunocomplexes were probed with antibodies to the indicated proteins.
Figure 4. PTPN14 regulates Roquin2 protein stability in a KLHL6-dependent manner by directly dephosphorylating tyrosine 691.
(a) HEK293T cells stably expressing HA-tagged KLHL6 were co-transfected with cDNAs encoding FLAG-tagged Roquin2 and V5-tagged PTPN14. Exogenous Roquin2 proteins were immunopurified from cell extracts with an anti-FLAG resin and immunocomplexes were probed with antibodies to the indicated proteins. Bottom panel shows whole cell lysates (WCL). HA, hemagglutinin. (b) The indicated FLAG-tagged proteins were immunopurified from HEK293T cell extracts with an anti-FLAG resin. Cells transfected with FLAG-tagged Roquin2 were pre-treated with 100µM of pervanadate for 15 min before collection. Purified proteins on the beads were mixed as indicated for in vitro phosphatase assay. Lamda (λ)-phosphotase treatment was used as a positive control for the assay. Proteins were probed with antibodies to the indicated proteins. Red asterisks indicate the FLAG-tagged proteins immunoblotted with an anti-FLAG antibody. (c) HEK293T cells were co-transfected with cDNAs encoding FLAG-HA-tagged Roquin2 (WT), FLAG-tagged KLHL6, and increasing amounts of V5-tagged PTPN14 in different combinations. Whole cell lysates were probed with antibodies to the indicated proteins. (d) Immunoblot analysis of whole-cell lysates from BJAB cells KLHL6+/+ or KLHL6−/- (clone derived) for the indicated serum starvation time points. (e) Same as in (d) except that BJAB cells stably expressing Roquin2(WT) or Roquin2(Y691F) were used. (f) OCI-LY10 cells were lenti-virally transduced to express doxycycline (DOX) controllable HA-tagged PTPN14 (WT) or PTPN14 (D1079A) mutant. DOX was pre-added for 12 hours and, then, cells were stimulated with anti-IgM (10µg/ml) with indicated time points. Whole cell lysates were probed with antibodies to the indicated proteins. CTRL, control. (g) A schematic model of the complex composed of Roquin2, KLHL6 and PTPN14. PTPN14 binds Roquin2 through its phosphatase (PTP) domain and KLHL6 binds Roquin2 at Y691 residue. PTPN14 regulates Roquin2 and KLHL6 interaction by direct dephosphorylation of Y691 in Roquin2. Phosphorylation, P.
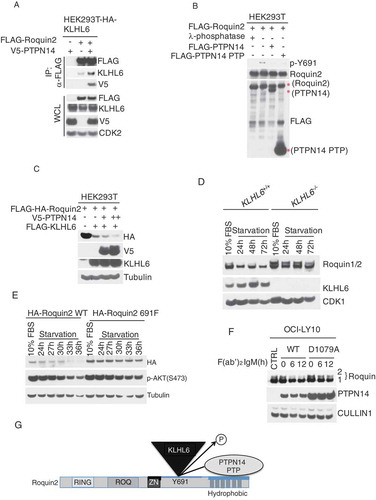
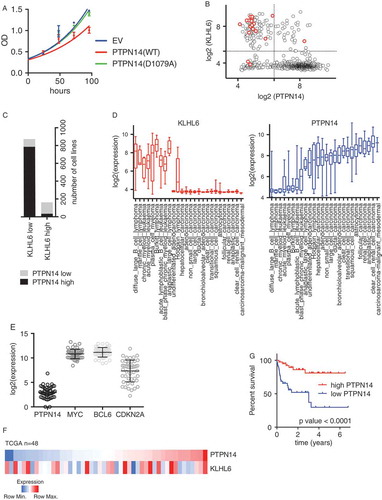
Figure 5. PTPN14 is a putative tumor suppressor in DLBCL (A) Cell proliferation of OCI-LY10 cells (from )) that were grown in media containing DOX was monitored by MTS assay and normalized on empty vector at day 1. Error bars represent s.d., n = 3. OD, optical density. (B) Scatter Plot showing the log2 expression of RNA-seq data for KLHL6 and PTPN14 from Cancer Cell Line Encyclopedia (CCLE, https://portals.broadinstitute.org/ccle, n = 1036). The red circles represent DLBCL cell lines. (C) Contingency table to summarize the relationship between PTPN14 and KLHL6 expression (n = 1036, Chi-square). (D) Plot of the log2 expression of RNA-seq data for KLHL6 (left panel) and PTPN14 (right panel) from the CCLE. Cell lines were grouped by tumor type. (E) RNA-seq data from The Cancer Genome Atlas (TCGA, http://cancergenome.nih.gov/) for the indicated transcripts (n = 48). (F) A heat map showing the gene expression profile of PTPN14 and KLHL6 in DLBCL tumors from TCGA (n = 48). (G) Kaplan–Meier analysis based on gene expression data for DLBCL tumors (GSE10846) using probe 226282_at is shown (n = 420, Mantel–Cox). Censored subjects are indicated as tick marks.