Figures & data
Figure 1. Spheroid cells had stem cell–like characteristics. (a) Images of the spheroids generated from adherent JEG-3 cells were shown from day 0 to day 6 cultured in serum-free media. Scale bar, 100 μm. (a) Day 0, (b) day 2, (c) day 4, and (d) day 6. (b) Clonogenicity of spheroids and adherent cells. Images of a single spheroid cell cultured in serum-free media were shown. (a) Day 1, (b) day 3, (c) day 5, (d) day 7, and (e) quantitation of colony-forming capabilities. (c) Stemness-related genes were examined using RT-PCR. (d) Drug resistance: spheroids and adherent cells were incubated with MTX (left) or VP16 (right), and the viability was measured using CCK-8 assay. (e) Flow cytometric analysis of the surface expression of CD44 and CD133. Each bar represents mean ± SD of three independent experiments. *P < 0.05, **P < 0.01, ***P < 0.001.
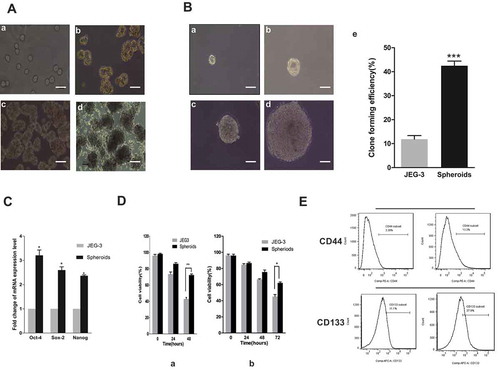
Figure 2. Expression of AhR increased in spheroids. (a) RT-PCR analysis of the mRNA expression of AhR (left) and Cyp1A1 (right) in spheroids and adherent cells. (b) Expression of AhR detected using Western blot analysis was shown (left). Respective change was depicted as fold change and β-actin served as the loading control (right). (c-d) Expression and localization of AhR in the spheroids and JEG-3 cells were shown by immunofluorescence. The percentage of AhR-positive cells was increased in the spheroid group compared to the adherent group. Scale bar, 100 μm. Each bar represents mean ± SD of three independent experiments. *P < 0.05, **P < 0.01, ***P < 0.001.
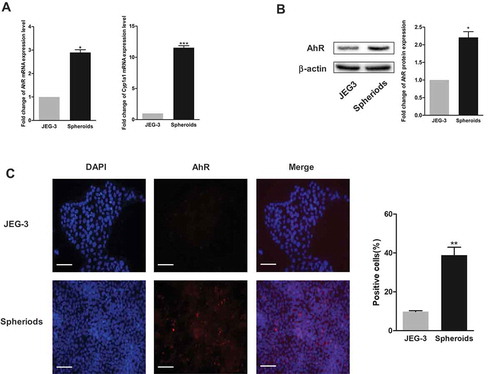
Figure 3. AhR regulated cell proliferation and drug resistance of choriocarcinoma cells. (a) AhR expression was significantly downregulated in JEG-3 and BeWo cells by transfection of AhR shRNA. (b) RT-PCR analysis of AhR and Cyp1A1 expression levels in JEG-3 and BeWo cells transduced with AhR shRNA or treated with TCDD. (c) Cell viability of JEG-3 and BeWo cells quantified by using CCK-8 assays. (d) The viability of JEG-3 and BeWo cells with or without AhR knockdown (shAhR) or TCDD treatment was measured by CCK-8 assay after treatment of cells with indicated concentrations of MTX(left) or VP16 (right). Each bar represents mean ± SD of three independent experiments. *P < 0.05, **P < 0.01, ***P < 0.001.
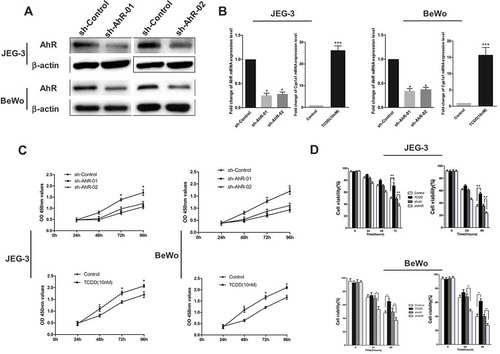
Figure 4. AhR promoted the spheroid formation. (a) Images of spheroids from JEG-3 cells with or without AhR activation (upper) or knockdown (lower) were shown. (b) The spheroids generated from 1000 cells of JEG-3 cells with or without TCDD treatment (right) and with or without AhR knockdown (left) were shown. (c) Images of spheroids from BeWo cells with or without AhR activation (upper) or knockdown (lower) were shown. (d) The spheroids generated from 1000 cells of BeWo cells with or without TCDD treatment (right) and with or without AhR knockdown (left) were shown. Data are presented as mean ± SD from three independent experiments. *P < 0.05.
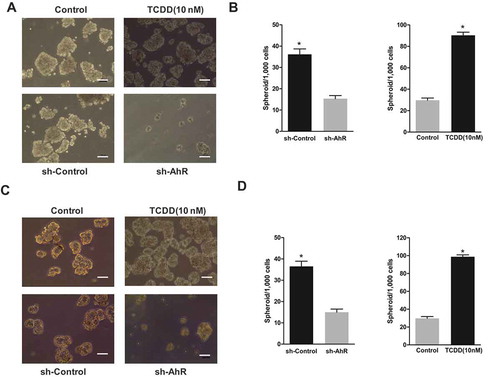
Figure 5. AhR knockdown suppressed tumorigenesis in vivo. (a) Representative image of mice on day 35 after injection of JEG-3 cells is shown. The sizes of resected tumors removed from mice on day 35 after injection of JEG-3 cells with or without AhR knockdown into nude mice were show. (b) Comparison of excised tumors weight in two groups. (c) Tumor size was measured on the indicated day after injection of corresponding cells into nude mice. (d)Tissues of every group were collected and stained with antibody against AhR (left) and ABCG2 (right) for IHC assays. Each bar represents mean ± SD (n = 6). *P < 0.05, **P < 0.01.
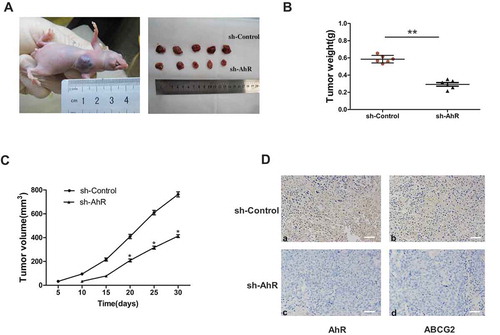
Figure 6. AhR transcriptionally activated ABCG2. (a) AhR-binding sites in ABCG2 promoter were marked with a box. Luciferase reporter assay was performed in JEG-3 cells transfected with shAhR or treated with TCDD and controls. (b) ChIP analysis of AhR binding to the ABCG2 promotor in the JEG-3 cells. qPCR was performed with primer specific to regions around the AhR-binding motifs (P1) and a control region (P2). (c) RT-PCR analysis of the ABCG2 level in JEG-3 cells (left) and BeWo cells (right) with AhR knockdown or activation compared with controls. (d) Western blot analysis results of JEG-3 (left) and BeWo (right) cells with or without AhR activation were shown. (e) RT-PCR analysis of the mRNA expression of ABCG2 in spheroids and JEG-3 cells. (f) Expression of ABCG2 detected in two groups using Western blot analysis was shown. Each bar represents mean ± SD of three independent experiments. *P < 0.05, **P < 0.01, ***P < 0.001.
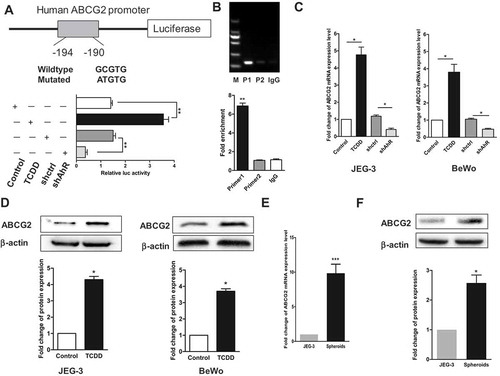
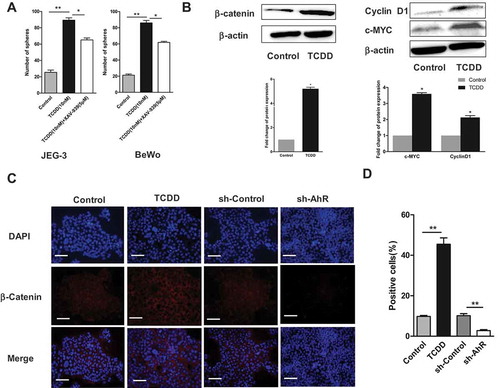
Figure 7. Wnt/β-Catenin pathway might be involved in AhR-mediated effects on CSC characteristics. (A) JEG-3 and BeWo cells were treated with TCDD in the presence and absence of Wnt inhibitor (XAV-939). The spheroids were counted. (B) The expression of β-catenin, Cyclin D1 and c-MYC (two β-catenin downstream targets) in JEG-3 cells treated with TCDD were determined using Western blot analysis. (C-D) JEG-3 cells treated with TCDD or stably transfected with AhR shRNA were stained with primary antibodies against β-catenin (red) followed by secondary antibodies and DAPI (blue). Then, β-catenin localization and nuclear translocation were determined using immunofluorescence assay. The percentages of β-catenin -positive cells in different groups were shown. Data are presented as mean ± SD from three independent experiments. *P < 0.05, **P < 0.01.