Figures & data
Figure 1. Pro-regenerative inflammatory mediators level in WT and IL-17RA−/− mice sera in liver regeneration after PH.
(a) IL-17 level in serum of WT and IL-17RA−/− mice. (b) IL-22 level in serum of WT and IL-17RA−/− mice. (c) TNFα level in serum of WT and IL-17RA−/− mice. D) IL-6 level in serum of WT and IL-17RA−/− mice. Bars represent means ±SD (n = 3). Experiments were repeated 3 times using 3 mice per group.
Figure 2. Evaluation of the Inflammatory Factor STAT3, the transcription factors cFos and cJun and the repressor of transcription factors Icer in liver of WT and IL-17RA−/− mice during liver regeneration.
(A) WB analysis of STAT3 protein expression during liver regeneration in WT and IL-17RA−/− mice. The protein amount was normalized to GAPDH protein expression. Representative data and averages of 3 replicates were shown. Experiments were repeated 3 times using 3–5 mice per group (left). Graph represents pSTAT3/STAT3 ratio of immunoblotting signal by densitometric quantification (right). (B) Analysis of STAT expression and localization in WT and IL-17RA−/− mice after PH. Representative micrographs of liver sections, immunostained using monoclonal STAT antibody (red) and DAPI (blue). Representative merge images were shown (right). Bars indicate 10 μm. Magnification, 400X. (C) mRNA levels of cFos, cJun and Icer expression, detected by qPCR in WT and IL-17RA−/− mice during liver regeneration at the indicated times following PH. The expression of each gene was normalized to mouse Gapdh levels. The mRNA amount was expressed in relative fold of expression. Bars represent means ±SD (n = 3). Experiments were repeated 3 times using 3 mice per group.
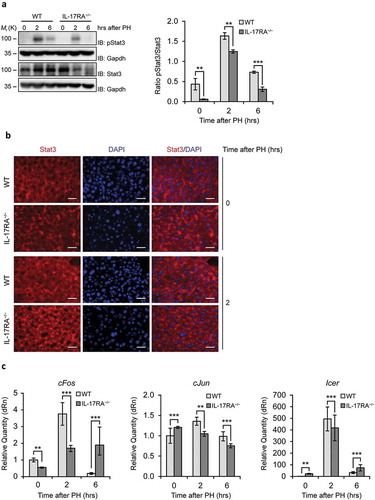
Figure 3. Defective proliferation in IL-17RA−/− mice regenerating livers.
(a) Quantitative analysis of BrdU labeling index (% of BrdU-positive hepatocytes) at each time of liver regeneration in WT and IL-17RA−/− mice. (left). Representative micrographs of liver sections collected from WT and IL-17RA−/− mice after PH, immunostained with anti-BrdU antibody (green) and DAPI (blue). Representative merge images were shown (right). The arrows indicate the BrdU-positive cells in a representative way. Bars indicate 10 μm. Magnification, 200X. (b) Expression of markers of G1/S phase during liver regeneration in WT and IL-17RA−/− mice. mRNA levels of Cyclin D1 and p27 were detected by qPCR in WT and IL-17RA−/− mice during liver regeneration following PH. The expression of each gene was normalized to mouse Gapdh levels. The amount of mRNA is expressed in relative fold of expression. Bars represent means ±SD (n = 3). Experiments were repeated 3 times using 3 mice per group. (c) Percentage of pH3-positive cells during liver regeneration in WT and IL-17RA−/− mice (right). Representative micrographs of liver sections, collected from WT and IL-17RA−/− mice after PH, immunostained with monoclonal pH3 antibody (green) and DAPI (blue). Representative merge images were shown (right). Bars indicate 10 μm. Magnification, 400X.
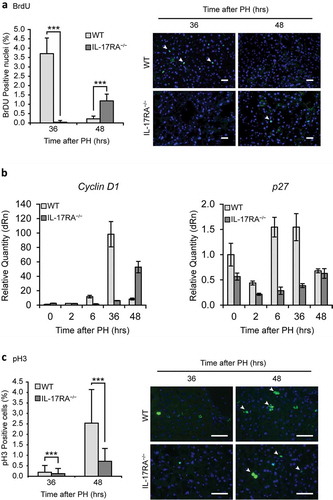
Figure 4. Gene Expression of IL-17A and downstream genes in liver.
mRNA levels of Il-17RA (a), C/ebpβ (b) and A20 (c) expression, detected by qPCR in WT and IL-17RA−/− mice during liver regeneration at the indicated times following PH. The expression of each gene was normalized to mouse Gapdh levels. The mRNA amount was expressed in relative fold of expression. Bars represent means ±SD (n = 3). Experiments were repeated 3 times using 3 mice per group. (d) Analysis of A20 expression and localization in WT and IL-17RA−/− mice after PH. Representative micrographs of liver sections, immunostained using monoclonal A20 antibody (green) and DAPI (blue). Representative merge images were shown (right). Bars indicate 10 μm. Magnification, 400X. A larger inset of stained areas was shown (bottom). Arrows indicate the nuclear staining of cells in Disse space.
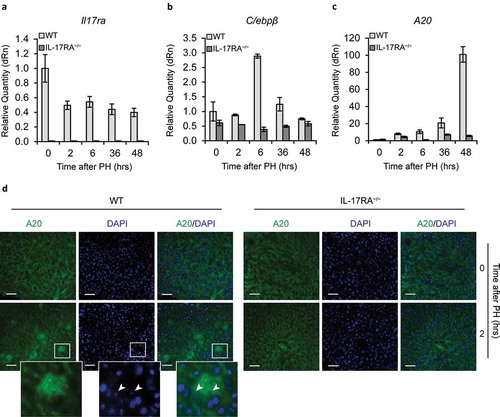
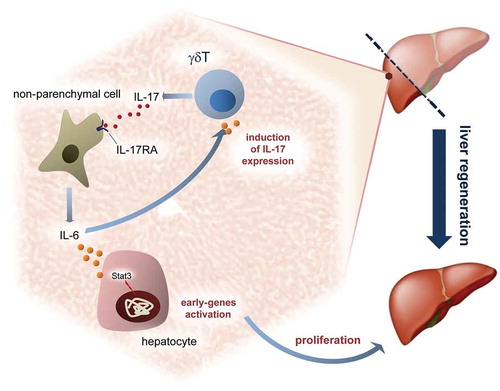
Figure 5. IL-17A modulates liver regeneration.
Schematic representation in the liver of putative role played by IL-17A in recruitment of non-parenchymal cells and proliferative control after partial hepatectomy.