Figures & data
Figure 1. Expression and subcellular localization of Survivin during porcine oocytes meiotic maturation. (a) Relative expression of Survivin mRNA in GV, GVBD, MI and MII stages; (b) Subcellular localization of Survivin during porcine oocytes maturation. N-Ctr: negative control; Bar = 25 µm. (c) The protein level of Survivin in in GV, GVBD, MI and MII stages. Proteins derived from a total of 300 oocytes were loaded for each sample.
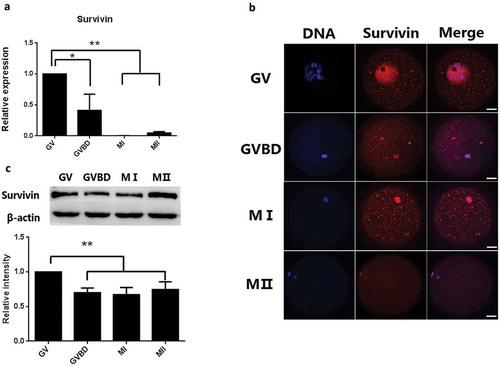
Figure 2. Survivin depletion led to oocytes arrested at the MI stage and impaired chromosome alignment. (a) Representative DIC images of oocytes and oocyte maturation percentage in the control and Survivin knockdown groups. Bar = 25 μm. ** P < 0.01 (b) Relative expression of Survivin mRNA in the control and Survivin knockdown groups after 24 h and 68 h siRNA injection. * P < 0.05, ** P < 0.01 (c) Expression of SURVIVIN protein in the siRNA-injected oocytes and relative levels of SURVIVIN protein between control and Survivin knockdown groups. Porcine COCs were injected with siRNA and incubated with dbcAMP for 20 h, followed by Western blotting. (d) Images of SURVIVIN (red) and chromosome (blue) in control and Survivin knockdown groups. Oocytes were stained with Survivin antibody to visualize the protein and co-stained with DAPI for chromosomes. Bar = 25 μm.
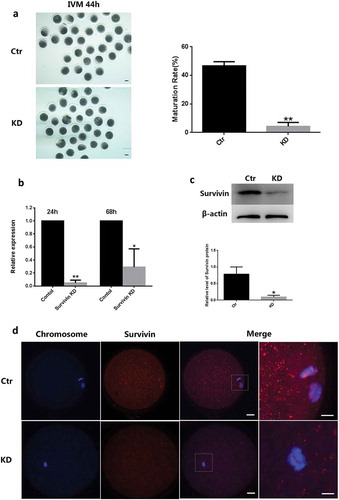
Figure 3. Survivin depletion led to chromosome misaligned and decrease of phosphorylated Auroa B. (a) Images of Spindle morphologies (green) and chromosome (blue) in control and Survivin knockdown groups. Oocytes were stained with α-tubulin-FITC antibody to visualize the spindles and co-stained with DAPI for chromosomes. Bar = 10 μm. (b) The percentage of spindle/chromosome defects in oocytes from the control and Survivin knockdown groups. (c) The protein level of Survivin, Aurora B, phosphorylated Aurora B and Mad2 examined by western blot in the control and Survivin knockdown groups in MI stage. And the relative level of each protein analysis was showed in (d). * P < 0.05, ** P < 0.01. (e) The protein level of Survivin, Aurora B, and phosphorylated Aurora B examined by western blot in the control and Survivin overexpression groups in MI stage. And the relative level of each protein analysis was showed in (f). * P < 0.05, ** P < 0.01.
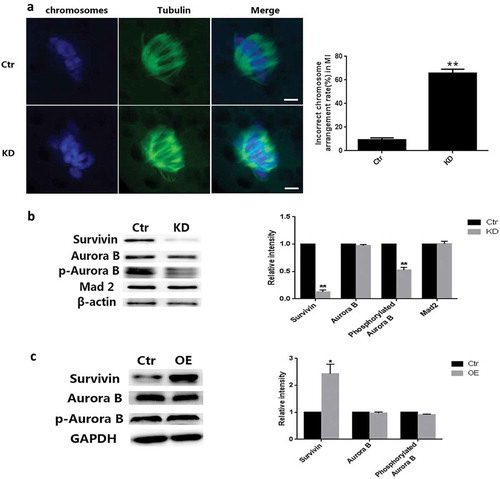
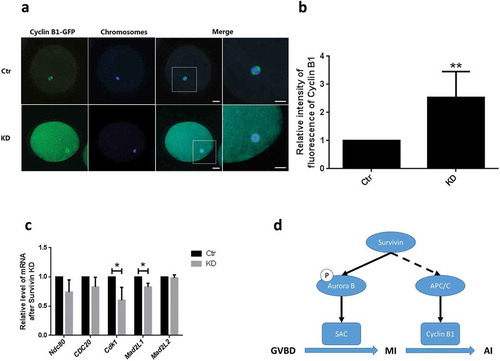
Figure 4. Survivin depletion inhibited Cyclin B1 degradation in oocytes at MI-AI. (a) Images of cyclin B1-GFP (green) in the control and Survivin knockdown groups. Cyclin B1 was immunolabled with GFP and examined by confocal microscopy. Bar = 25 μm (b) The average fluorescence intensity of Cyclin B1-GFP in the control and Survivin knockdown groups. (c) Relative expression of SAC or APC/C associated genes which were Cdc25b, Cdc20, Cdk1, Mad2L1 and Mad2L2. * P < 0.05. (d) Schematic illustrating function of Survivin during porcine oocytes maturation.