Figures & data
Figure 1. Expression and subcellular localization of PHF1 during oocyte maturation. (a) Subcellular localization of PHF1 (green) at GV, GVBD, pre-MI, MI, AI-TI and MII stages by confocal microscope scanning. DNA of chromosomes was stained with PI (Propidium iodide, red). Scale bar = 20 μm. (b) Oocytes of mouse at different stages of meiotic maturation were collected for Western blot. Proteins from a total of 100 oocytes were loaded for each sample. PHF1 level were detected by anti-PHF1 antibody and α-tubulin was used as a loading control. PHF1 amount at each stage from a representative experiment was quantified and displayed as indicated. (c) PHF1 amount at each stage from 4 independent Western blot analysis experiments was quantified. Data were normalized to the abundance of internal control α-tubulin. Data are shown as mean ± SEM from three independent experiments, p < 0.001 or 0.05.
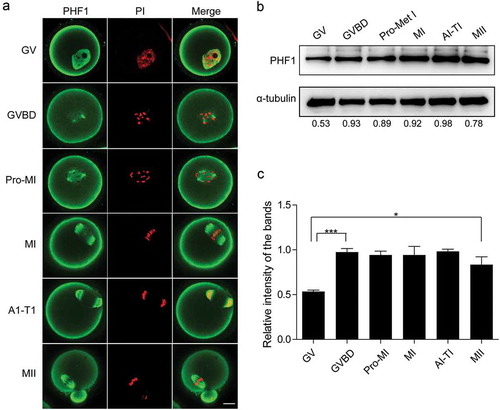
Figure 2. Localization of PHF1 in mouse oocytes treated with taxol and nocodazole. (a) Oocytes cultured for 7 h and 13 h, corresponding to MI and MII stages, respectively. These oocytes were fixed and co-stained with PHF1 (red) and α-tubulin (green). DNA (blue) was visualized with Hoechst 33342 staining. Scale bar = 20 μm. (b) Oocytes at MI stage were incubated in M2 medium with 10 μM taxol for 45 min and then double stained with PHF (red) and α-tubulin (green). The sample was counterstained with Hoechst 33342 to visualize DNA. Scale bar = 20 μm. (c) The MI oocyte first treated with M2 medium containing 10 mg/ml nocodazole, and then washed thoroughly with fresh M2 medium. After recovering for 30 min the oocytes were fixed and stained for PHF1 (red), α-tubulin (green) and DNA (blue). Scale bar = 20 μm.
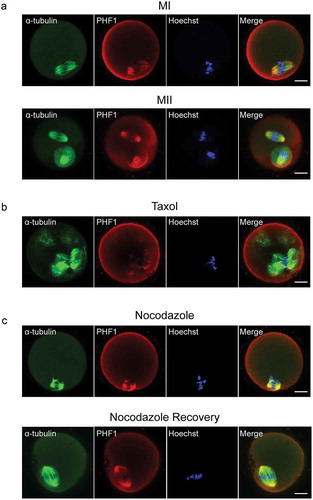
Figure 3. Lack of PHF1 affects the first polar body extrusion and leads to chromosome misalignment. (a) Depletion of PHF1 was determined by Western blot analysis using PHF1 antibody after endogenous PHF1 was depleted by siRNA. And α-tubulin was used as a loading control. (b) PB1extrusion rates were decreased after siRNA treatment. Data were presented as mean ± SEM from three independent experiments. Different superscripts indicate statistical difference at 10 h, 12 h and 13 h (p < 0.05). (c) Oocytes microinjected with the PHF-siRNA displayed chromosome misalignment. Part of them demonstrated “2-cell-like” oocytes (Panel 2). (d) Percentage of oocytes with chromosome misalignment in the PHF1-siRNA microinjected group and Control. Data were presented as mean ± SEM from three independent experiments, p < 0.05.
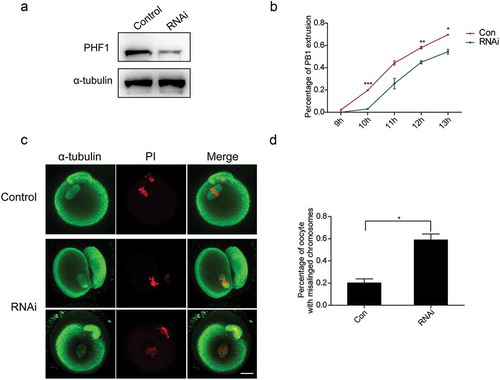
Figure 4. Effects of PHF1 depletion on actin cap formation, K-MT attachment and oocyte karyotype. (a) At the MI stage, no actin cap formed in PHF-siRNA group while an actin cap formed in the control group, and antibody injection oocytes. These oocytes were co-stain with a-tubulin (green) and Phalloidin (red). DNA of chromosomes was stained with Hochest33341. Scale bar = 20 μm. (b) The MI oocytes were cultured at 4°C for 10 min after microinjected with Control/PHF-siRNA. Images were acquired with a laser confocal microscope. Green: α-tubulin; Blue: Crest; Red: DNA. Scale bar = 5 μm. (c) Chromosome spreading was performed of MII oocytes after Control and PHF1-siRNA injection. Representative images of euploid and aneuploid oocytes were shown. (d) Quantification of aneuploidy in the control and PHF1 knockdown oocytes. The data were presented as mean ± SEM, p < 0.05.
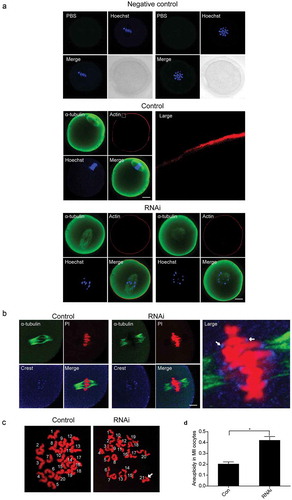
Figure 5. Raised level of PHF1 in oocytes disturbs the first polar body extrusion and chromosome alignment. (a) Western blot analysis was applied to confirm the microinjection of Myc-EZH2 into oocyte with a Myc antibody. The α-tubulin antibody was used as a loading control. (b) The rate of PB1extrusion between the control and mRNA-PHF1 groups at 11 h and 13 h were determined separately. Data were presented as mean ± SEM from three independent experiments, p < 0.01. (c) Increased level of PHF1 causes chromosome misalignment. Green: α-tubulin; Red: DNA. Scale bar = 20 μm. (d) Percentage of oocytes with chromosome misalignment at MII stage was quantified. Data were expressed as mean ± SEM from three independent experiments, p < 0.05. (e, f) Raised level of PHF1 in oocytes leads to aneuploidy. Chromosome spreading was performed in oocytes microinjected with the control or Myc-PHF1 mRNA and aneuploidy was seen (e). Percentage of aneuploidy occurrence was quantified (f). Data were expressed as mean ± SEM from three independent experiments, p < 0.05.
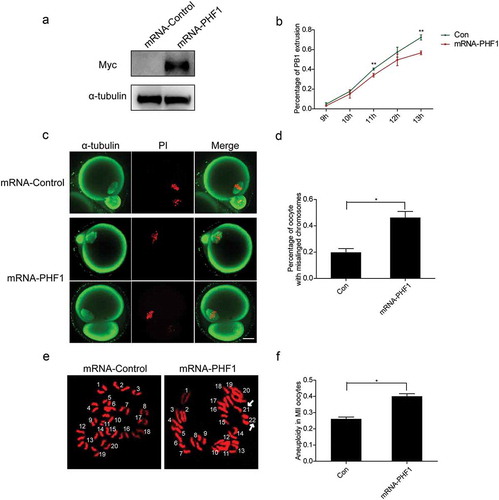
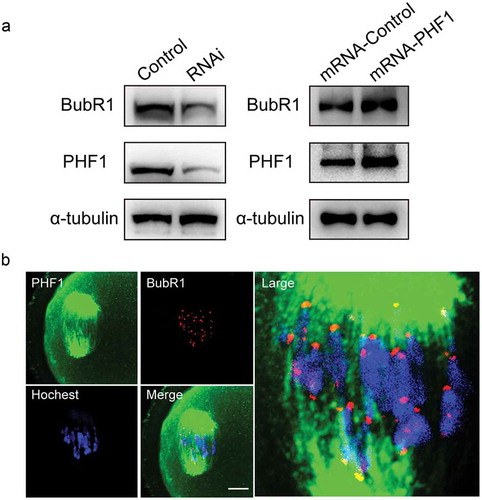
Figure 6. PHF1 regulate the expression of BubR1 in oocytes. (a) Western blot analysis showed that BubR1 protein level was decreased by siRNA depletion of endogenous PHF1 in oocytes (Left panel), and raised in oocytes with microinjection of PHF1 mRNA (Right panel). (b) Immunofluorescence images demonstrate no apparent co-localization of PHF1 and BubR1 in oocytes. Oocytes were stained with an EZH2 antibody (green), BubR1 was stained with a goat antibody (red) and chromosome were stained by Hoechst 33342. Scale bar = 5 μm.