1,495
Views
14
CrossRef citations to date
0
Altmetric
Research Paper

MAPT (Tau) expression is a biomarker for an increased rate of survival in pediatric neuroblastoma

ORCID Icon, &
Pages 2474-2483 | Received 07 Jul 2018, Accepted 19 Oct 2018, Published online: 18 Nov 2018

Figures & data

Figure 1. Kaplan-Meier curves representing distinct MAPT gene expression levels. (A) Kaplan-Meier (KM) overall survival (OS) curve representing pediatric neuroblastoma barcode microarray values in the top quintile of MAPT expressers (n = 48, gray, arrow), compared to the OS for the bottom quintile of MAPT expressers (n = 49, black). Mean OS for the top quintile of MAPT expressers, undefined months; mean OS for bottom quintile of MAPT expressers, 37 months. Log rank comparison p-value = 0.0023. (B) KM OS curve for ovarian serous cystadenocarcinoma (OV) barcode microarray values in the top quintile of MAPT expressers (n = 103, gray, arrow), compared to the OS for the bottom quintile of MAPT expressers (n = 102, black). Mean OS for the top quintile of MAPT expressers, 38.40 months; mean OS for bottom quintile of MAPT expressers, 47.57 months. Log rank comparison p-value = 0.3471 (not significant). (C) KM OS curve for pediatric neuroblastoma barcode microarray values in the top quintile of SNCA expressers (n = 48, gray, arrow), compared to the OS for the bottom quintile of SNCA expressers (n = 49, black). Mean OS for the top quintile of SNCA expressers, undefined months; mean OS for bottom quintile of SNCA expressers, 52 months. Log rank comparison p-value = 0.1370 (not significant). (D) KM OS curve for pediatric neuroblastoma barcode RNAseq values in the top half of MAPT expressers (n = 68, gray, arrow), compared to the OS for the bottom half of MAPT expressers (n = 66, black). Mean OS for the top half of MAPT expressers, 125 months; mean OS for bottom half of MAPT expressers, 44 months. Log rank comparison p-value = 0.0074. (E) KM OS curve for pediatric neuroblastoma barcode RNAseq values in the top quintile of MAPT expressers (n = 27, gray, arrow), compared to the OS for the bottom quintile of MAPT expressers (n = 28, black). Mean OS for the top quintile of MAPT expressers, 80 months; mean OS for bottom quintile of MAPT expressers, 34 months. Log rank comparison p-value = 0.2205.
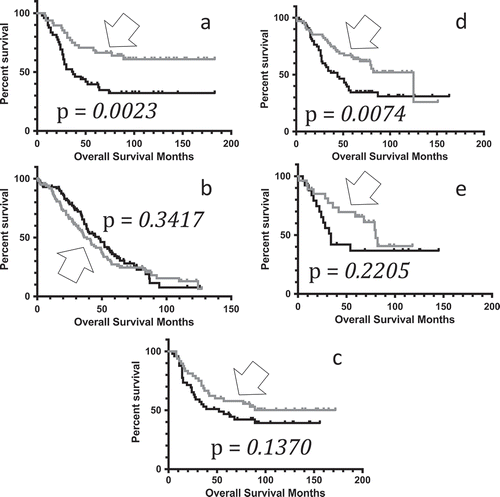
Figure 1. Kaplan-Meier curves representing distinct MAPT gene expression levels. (A) Kaplan-Meier (KM) overall survival (OS) curve representing pediatric neuroblastoma barcode microarray values in the top quintile of MAPT expressers (n = 48, gray, arrow), compared to the OS for the bottom quintile of MAPT expressers (n = 49, black). Mean OS for the top quintile of MAPT expressers, undefined months; mean OS for bottom quintile of MAPT expressers, 37 months. Log rank comparison p-value = 0.0023. (B) KM OS curve for ovarian serous cystadenocarcinoma (OV) barcode microarray values in the top quintile of MAPT expressers (n = 103, gray, arrow), compared to the OS for the bottom quintile of MAPT expressers (n = 102, black). Mean OS for the top quintile of MAPT expressers, 38.40 months; mean OS for bottom quintile of MAPT expressers, 47.57 months. Log rank comparison p-value = 0.3471 (not significant). (C) KM OS curve for pediatric neuroblastoma barcode microarray values in the top quintile of SNCA expressers (n = 48, gray, arrow), compared to the OS for the bottom quintile of SNCA expressers (n = 49, black). Mean OS for the top quintile of SNCA expressers, undefined months; mean OS for bottom quintile of SNCA expressers, 52 months. Log rank comparison p-value = 0.1370 (not significant). (D) KM OS curve for pediatric neuroblastoma barcode RNAseq values in the top half of MAPT expressers (n = 68, gray, arrow), compared to the OS for the bottom half of MAPT expressers (n = 66, black). Mean OS for the top half of MAPT expressers, 125 months; mean OS for bottom half of MAPT expressers, 44 months. Log rank comparison p-value = 0.0074. (E) KM OS curve for pediatric neuroblastoma barcode RNAseq values in the top quintile of MAPT expressers (n = 27, gray, arrow), compared to the OS for the bottom quintile of MAPT expressers (n = 28, black). Mean OS for the top quintile of MAPT expressers, 80 months; mean OS for bottom quintile of MAPT expressers, 34 months. Log rank comparison p-value = 0.2205.

Table 1. Average microarray values for pediatric neuroblastoma barcodes representing high and low expression of MAPT.

Figure 2. Correlation of MAPT and apoptosis-effector gene expression levels. MAPT microarray expression vs. apoptosis-effector gene microarray expression. The p-values for the Pearson Correlation Coefficients are presented after each relationship, respectively. (A) MAPT vs. AIFM2; p = 0.0008; (B) MAPT vs. BAD; p = 0.0051; (C) MAPT vs. CASP3; p = 0.0050; (D) MAPT vs. CASP9; p < 0.0001; (E) MAPT vs. COX6A1; p = 0.0005; (F) MAPT vs. CRADD; p < 0.0001; (G) MAPT vs. GZMB; p = 0.0205.
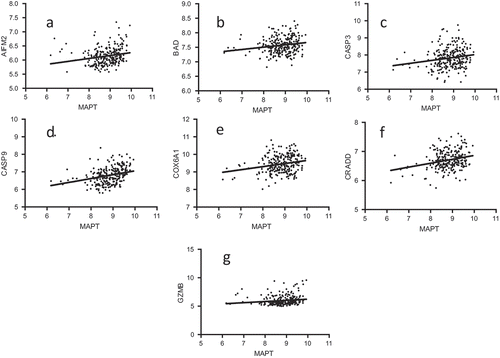
Figure 2. Correlation of MAPT and apoptosis-effector gene expression levels. MAPT microarray expression vs. apoptosis-effector gene microarray expression. The p-values for the Pearson Correlation Coefficients are presented after each relationship, respectively. (A) MAPT vs. AIFM2; p = 0.0008; (B) MAPT vs. BAD; p = 0.0051; (C) MAPT vs. CASP3; p = 0.0050; (D) MAPT vs. CASP9; p < 0.0001; (E) MAPT vs. COX6A1; p = 0.0005; (F) MAPT vs. CRADD; p < 0.0001; (G) MAPT vs. GZMB; p = 0.0205.

Figure 3. Kaplan-Meier curves representing distinct apoptosis-effector gene expression levels. (A) KM OS curve for pediatric neuroblastoma barcode microarray values in the top quintile of CASP3 expressers (n = 49, gray, arrow), compared to the OS for the bottom quintile of CASP3 expressers (n = 49, black). Mean OS for the top quintile of CASP3 expressers, undefined months; mean OS for bottom quintile of CASP3 expressers, 37 months. Log rank comparison p-value, p = 0.0052. (B) KM OS curve for pediatric neuroblastoma barcode microarray values in the top quintile of CASP9 expressers (n = 49, gray, arrow), compared to the OS for the bottom quintile of CASP9 expressers (n = 49, black). Mean OS for the top quintile of CASP9 expressers, undefined months; mean OS for bottom quintile of CASP9 expressers, 38.5 months. Log rank comparison p-value, p = 0.0353.
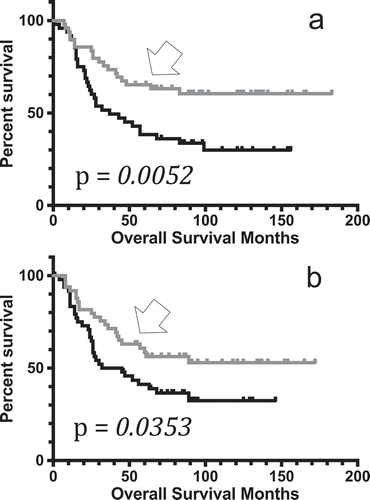
Figure 3. Kaplan-Meier curves representing distinct apoptosis-effector gene expression levels. (A) KM OS curve for pediatric neuroblastoma barcode microarray values in the top quintile of CASP3 expressers (n = 49, gray, arrow), compared to the OS for the bottom quintile of CASP3 expressers (n = 49, black). Mean OS for the top quintile of CASP3 expressers, undefined months; mean OS for bottom quintile of CASP3 expressers, 37 months. Log rank comparison p-value, p = 0.0052. (B) KM OS curve for pediatric neuroblastoma barcode microarray values in the top quintile of CASP9 expressers (n = 49, gray, arrow), compared to the OS for the bottom quintile of CASP9 expressers (n = 49, black). Mean OS for the top quintile of CASP9 expressers, undefined months; mean OS for bottom quintile of CASP9 expressers, 38.5 months. Log rank comparison p-value, p = 0.0353.

Table 2. Average microarray values for pediatric neuroblastoma barcodes representing high and low expression of MAPT.

Table 3. Identifying MYCN copy number variation associations with MAPT expression (For details, see Table S13).

Supplemental material

Supplemental Material

Download PDF (1.4 MB)

Reprints and Corporate Permissions

Please note: Selecting permissions does not provide access to the full text of the article, please see our help page How do I view content?

To request a reprint or corporate permissions for this article, please click on the relevant link below:

Academic Permissions

Please note: Selecting permissions does not provide access to the full text of the article, please see our help page How do I view content?

Obtain permissions instantly via Rightslink by clicking on the button below:

If you are unable to obtain permissions via Rightslink, please complete and submit this Permissions form. For more information, please visit our Permissions help page.