Figures & data
Figure 1. Renal expression patterns of miR-130a-5p and PLA2R in MN.
(a) The expression of miR-130a-5p in renal biopsy specimens from MN patients (n = 30) or 30 controls was detected using qRT-PCR. (b) Western blot analysis of PLA2R expression in renal biopsy specimens from MN patients (n = 30) or 30 controls. **P < 0.01 compared with the control (Normal).
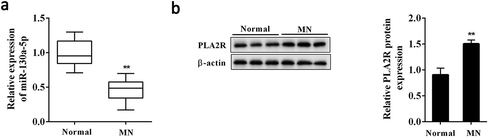
Figure 2. Ang II inhibited miR-130a-5p expression in AB8/13 cells.
Human podocyte cell line AB8/13 was treated with Ang II (100 nmol/L) for 24 h. (a) The expression of miR-130a-5p in podocytes as determined by qRT-PCR. (b) Western blot analysis of PLA2R expression in podocytes. **P < 0.01 compared with Control.
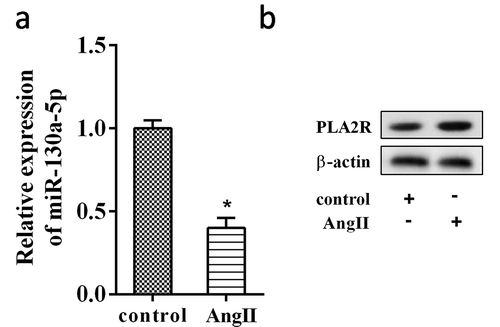
Figure 3. Effect of miR-130a-5p on podocyte apoptosis induced by Ang II.
AB8/13 cells were transfected with miR-130a-5p mimic or its negative control, pre-NC. After 24 h of transfection, the cells were treated with Ang II (100 nmol/L) for another 24h. (a) The caspase-3 activity was detected using a Caspase-3 Activity Assay Kit. (b) Cell apoptosis was analyzed by flow cytometry. **P < 0.01 compared with Control; #P < 0.01 compared with Ang II+ pre-NC.
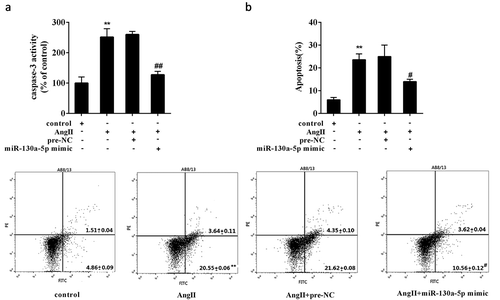
Figure 4. Interaction between miR-130a-5p and PLA2R.
(a) Putative miR-130a-5p binding sites in the 3-UTR of PLA2R (PLA2R-WT). And the 3-UTR of PLA2R with mutated miR-130a-5p binding sites (PLA2R-Mut) was also generated. (b) Dual-luciferase reporter gene assay. Luciferase reporter gene vector containing PLA2R-WT or PLA2R-Mut combined with miR-130a-5p mimic, pre-NC, miR-130a-5p inhibitor, or NC were co-transfected into AB8/13 cells. After 48h, luciferase activity was detected using Dual Luciferase Assay System. (c) Effect of miR-130a-5p on PLA2R expression. AB8/13 cells were transfected with miR-130a-5p mimic, pre-NC, miR-130a-5p inhibitor, or NC. The expression of PLA2R was analyzed by qRT-PCR and Western blot analysis. NC, the negative control for miR-130a-5p inhibitor. *P < 0.05 compared with PLA2R-WT+ pre-NC, PLA2R-WT+ NC, or pre-NC; **P < 0.01 compared with NC.
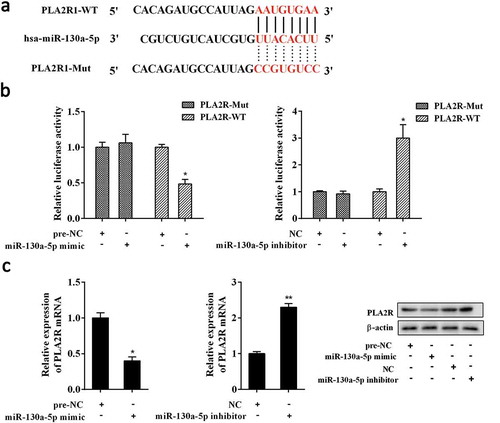
Figure 5. Down-regulated miR-130a-5p induced podocyte apoptosis via modulating PLA2R.
AB8/13 cells were transfected with miR-130a-5p inhibitor alone or combined with siRNA targeting PLA2R (si-PLA2R). Analysis of (a) the caspase-3 activity and (b) cell apoptosis after 48 h of transfection. si-control, the negative control for si-PLA2R. *P < 0.05, **P < 0.01 compared with NC; #P < 0.05, ##P < 0.01 compared with miR-130a-5p inhibitor+ si-control.
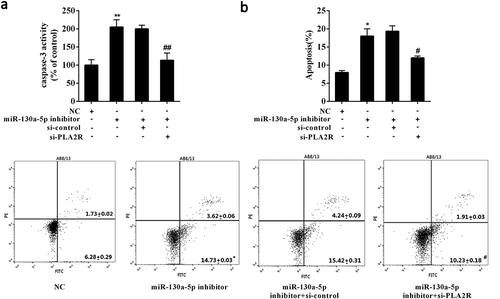
Figure 6. Overexpressed miR-130a-5p attenuated the Ang II induced-podocyte apoptosis by modulating PLA2R.
AB8/13 cells were transfected with miR-130a-5p mimic alone or combined with expression plasmids of PLA2R (pcDNA-PLA2R) followed by treatment of Ang II. (a) The caspase-3 activity and (b) cell apoptosis were determined. pcDNA, the negative control for pcDNA-PLA2R. **P < 0.01 compared with Control; ##P < 0.01 compared with Ang II+ pre-NC; &P < 0.05, &&P < 0.01 compared with Ang II+ miR-130a-5p mimic+ pcDNA.
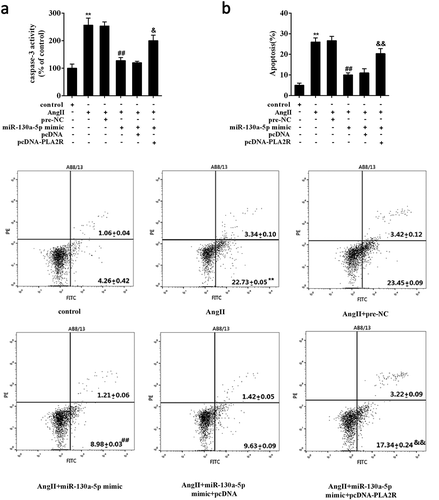
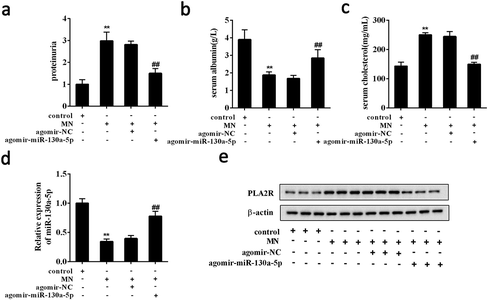
Figure 7. Overexpressed miR-130a-5p alleviated renal injury in MN mice.
BALB/c female mice were randomly divided into 4 groups (n = 7 per group): control, MN, MN+ agomir-miR-130a-5p, MN+ agomir-NC. MN mice induced by intravenous injection of cBSA received agomir-miR-130a-5p or agomir-NC. The levels of (a) proteinuria, (b) serum albumin, and (c) serum cholesterol were detected in each mouse. (d) The expression of miR-130a-5p in renal tissues was detected using qRT-PCR. (e) The protein expression of PLA2R was determined using Western blot analysis. **P < 0.01 compared with control; ##P < 0.01 compared with MN+ agomir-NC.