Figures & data
Figure 1. SAMHD1 inhibits JSRV Env-induced in vitro transformation of MDCK epithelial cells. MDCK cells were transfected with JSRV Env and empty vector or JSRV Env and plasmids expressing N-terminal hemagglutinin (HA)-tagged human SAMHD1 (hSAMHD1) or mouse SAMHD1 (mSAMHD1, isoform 1). (a) Exogenous SAMHD1 protein expression was assessed by immunoblotting using anti-HA antibodies. GAPDH was used as a loading control. (b) Cell images show the representative transformed foci 4 weeks post-transfection. Magnification, 10 × . (c) Relative transformation efficiency in MDCK cells from 3 independent experiments was quantified as presented. MDCK cells transfected with JSRV Env expression plasmid along with pLenti puro empty vector or plasmids encoding hSAMHD1 or mSAMHD1 (isoform 1). At 24 h post-transfection, the cells were split and cultured in the presence of puromycin (4 μg/ml) and G418 (1 mg/ml). The medium with antibiotics was replaced every 4 days. Transformed foci were counted and cell image were obtained 4 weeks after transfection (representative images are shown in b). Values of vector control were set to 100%. **, p = 0.0038; ***, p < 0.0001.
Figure 2. Inhibition of JSRV-Env-induced transformation by SAMHD1 is independent of its dNTPase activity. (a) Stable expression of human HA-tagged wild-type (WT) SAMHD1 and the dNTPase-defective HD/AA-SAMHD1 in the MDCK stable cell lines was detected by immunoblotting. GAPDH was a loading control. Relative levels of SAMHD1 were quantified by densitometry analysis and normalized by GAPDH levels. (b) MDCK cell lines stably expressing WT-SAMHD1 or HD/AA-SAMHD1 along with parental and vector control cells were transfected with a plasmid encoding JSRV Env. Four weeks post-transfection, transformed foci were counted and plotted. Presented data were obtained from 3 independent experiments. *, p ≤ 0.017.
Figure 3. Stable SAMHD1 expression in MDCK cells significantly affects cell cycle distribution, but not cell proliferation. (a) MDCK cell lines stably expressing WT-SAMHD1 or HD/AA-SAMHD1 along with parental and vector control cells were analyzed by an MTT-based cell proliferation assay at the indicated time points. One representative experiment performed in three replicates is shown. OD, optical density (490 nm). (b) At 24 h post-seeding, MDCK cell lines were stained with propidium iodide and cell cycle analysis was performed via flow cytometry. Percentages of cells in G1/G0, S, and G2/M phases of cell cycle are presented. Each experiment was performed in three biological replicates. **, p = 0.0011; ***, p = 0.0006.
Figure 4. Establishment of intravenous AML mouse xenograft in vivo imaging model and pathological analysis. THP-1 control (Ctrl-fLuc) and SAMHD1 KO (KO-fLuc) cells stably expressing fLuc were analyzed (a) via immunoblotting to determine SAMHD1 expression and (b) via in vitro luciferase assays to detect levels of fLuc expression in comparison to parental cells (background is shown). At 24 h post-seeding, cells were analyzed for (c) proliferation using an MTT-based assay, and for (d) caspase-3/7 activity. ***, p ≤ 0.0002. (e) NSG mice were injected intravenously with THP-1 control (Ctrl)-fLuc or SAMHD1 KO-fLuc cells as described. On the indicated days post-injection (dpi), each mouse was injected intraperitoneally with D-luciferin, and bioluminescent images were taken at 10 min delay and 5 min exposure. Representative images are presented. One mouse injected with Ctrl-fLuc cells died due to tumor metastasis at 35 dpi. (f) Gross necropsy was performed on a mouse injected with SAMHD1 KO cells at 35 dpi.
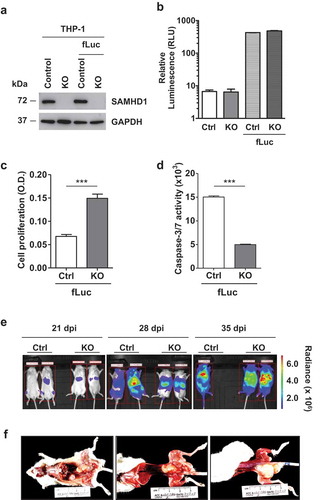
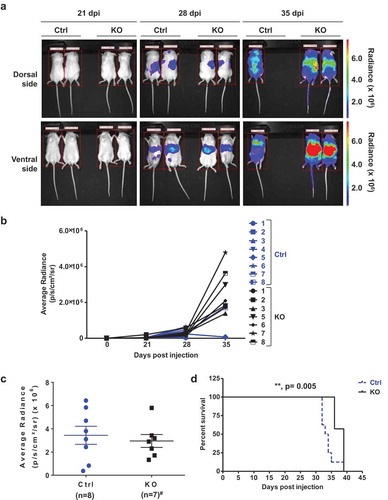
Figure 5. SAMHD1 affects AML-derived leukemogenesis in vivo. (a) NSG mice were injected intravenously with THP-1 Ctrl-fLuc (n = 8; 3 × 10⁶ per mouse) or KO-fLuc cells (n = 7; 3 × 10⁶ per mouse). On the indicated days post-injection (dpi) of cells, each mouse was injected intraperitoneally with D-luciferin, and bioluminescent images were taken at 10 min delay and 5 min exposure. Representative images are presented. (b) THP-1 cell-derived tumor growth was monitored by measuring the average radiance (p/s/cm2/sr) per mouse to determine the relative tumor growth and metastasis at 21, 28, and 35 dpi. (c) Average radiance from the Ctrl cell-injected mice (n = 8) and KO cell-injected mice (n = 7, #one mouse died due to non-experimental reasons) is presented at 28 dpi. (d) Percentage survival of mice (n = 8 for Ctrl and n = 7 for KO) was quantified using Kaplan-Meier curve survival analysis. **, p = 0.005.