Figures & data
Figure 1. Lentivirus-infected cell lines expressing control, MCM2 or MCM3 shRNA. U2OS cells were infected with either a control shRNA, or shRNAs targeting and decreasing MCM2 (a) or MCM3 (b) expression. Cell extracts were resolved by SDS-PAGE and proteins revealed by immunoblotting using MCM2, MCM3 or GAPDH antibodies. The fold reduction compared to the control and normalized with GAPDH is shown on the right. (c) Growth curves of U2OS shControl, shMCM2 and shMCM3 cell lines over 72 h. A total of 100,000 cells were seeded at time 0, and counted every 24 hours (n = 3). (d) FACS analysis of cells expressing shControl, shMCM2 or shMCM3 using propidium iodine staining. (e) Cell extracts from U2OS cells expressing either a control shRNA, or shRNAs targeting MCM2 or MCM3 were resolved by SDS-PAGE and proteins revealed by immunoblotting using MCM2, MCM3, MCM5, MCM7 or GAPDH antibodies. The ratio compared to the control and normalized with GAPDH is shown on the right.
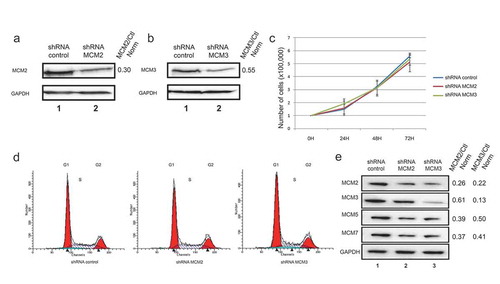
Figure 2. Phosphorylation of H2AX on serine 139 following Etoposide-induced DNA damage in U2OS cell lines knocked-down for MCM2 or MCM3. U2OS cell lines expressing either a control shRNA, or shRNAs targeting MCM2 or MCM3 were treated or not for 1 hour with 1 or 10 µM Etoposide. Cell extracts were resolved by SDS-PAGE and proteins were revealed by immunoblotting using MCM2, MCM3, γ-H2AX and GAPDH antibodies. The ratio compared to the control and normalized with GAPDH is shown under each band, where applicable.
Figure 3. Phosphorylation of H2AX on serine 139 following Etoposide-induced DNA damage in U2OS cell lines knocked-down for MCM2 or MCM3. U2OS cells knocked-down with either a control shRNA, or shRNAs targeting MCM2 or MCM3 were treated or not for 1 hour (a) or 19 hours (b) with 1 or 10 µM Etoposide. Equal amounts of total cell lysates were separated by SDS-PAGE, and the proteins revealed by immunoblotting using the indicated antibodies. The ratio compared to the control and normalized with GAPDH is shown under each band, where applicable.
Figure 4. Knock-down of MCM proteins does not affect cell sensitivity to Etoposide. Control cells or cells expressing shRNA for MCM2 and MCM3 were treated with increasing concentrations of Etoposide for 48 hours (a) or 72 hours (b), and cell viability was assessed using MTT assays to determine viability and the distribution within the cell cycle was analyzed by FACS analysis (c,d). The cell cycle distribution of three independent FACS analyses showed no significant differences between the cells expressing the shControl when compared with cells knocked-down for MCM2 or MCM3. (e,f) The cell cycle distributions from the three independent FACS analysis were averaged and are displayed as histograms with the percentage of cells in each phases of the cell cycle displayed.
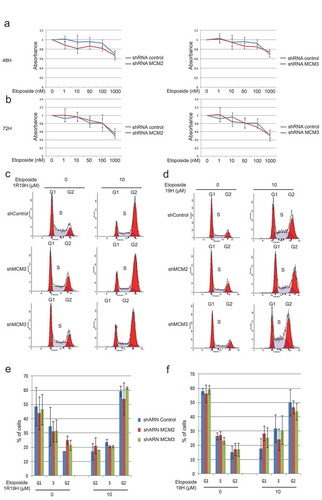
Figure 5. Quantification of S-phase by EdU labeling. 293 and U2OS cells expressing shRNA for MCM2 and MCM3 were incubated with EdU for 2 h, followed by detection of EdU-DNA by Click-iT chemistry (Alex Fluor 488). Fluorescence was measured by FACS analysis by counting 100,000 cells. The experiment was repeated 3 times (n = 3) for each condition.
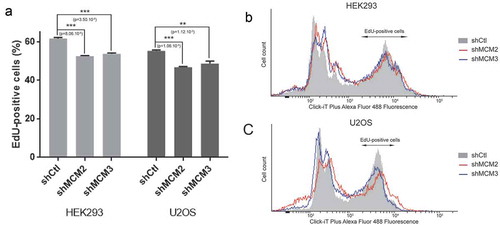
Figure 6. Destabilization of the MCM complex leads to an alteration in Homologous Recombination but not in Non-Homologous End Joining. HEK-293 cells with stable incorporation of pHR-GFP and pNHEJ-GFP plasmids were infected with shControl, shMCM2 or shMCM3 lentiviruses, and cells stably expressing shRNAs were selected using puromycin. ShRNA targeting MCM2 or MCM3 destabilized the MCM complex in HEK-293 cells, as demonstrated by immunoblotting of whole cell lysates (a,b). The ratio compared to the control and normalized with GAPDH is shown under each band. An ISce1-expressing plasmid was transfected and cells were incubated for 96 hours to induce specific DSB in the HEK-293 stable cell lines. GFP-positive cells were counted using FACS analysis for homologous recombination (c) or non-homologous end-joining (d). Three replicates of each experiment were performed (e,f).
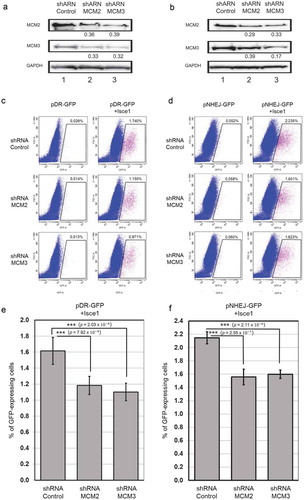
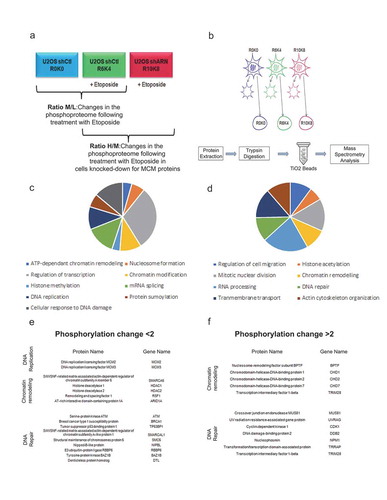
Figure 7. Effects of a decrease in the MCM complex on the phosphoproteome in response to double-strand breaks. U2OS cells infected with shRNAs against MCM2 or MCM3 were cultured in different SILAC media and treated with Etoposide, fractionated and then digested to purify the phosphopeptides. (a) The U2OS shControl cell line was cultured in light SILAC medium (R0K0) and untreated, or cultured in SILAC medium (R6K4) and treated for 1 hour with 10 μM Etoposide. U2OS cells infected with shRNAs against MCM2 or MCM3 were cultured in heavy SILAC medium (R10K8) and subsequently treated for 1 hour with 10 μM Etoposide. (b) The cells were fractionated to isolate the nuclear proteins, after which the proteins were extracted, digested with trypsin and purified on titanium dioxide beads before identification and quantification by mass spectrometry. (c,d) Proteins with a >2-fold increase (c) or >2-fold decrease (d) in phosphorylation were analyzed for gene ontology pathway enrichment using David 2.0. The pathways including at least four proteins and those with a p-value <0.01 for an increase or decrease in phosphorylation are presented. (e,f). Lists of proteins identified and known to play a role in chromatin remodeling, DNA repair or DNA replication mechanisms in response to DNA damage.