Figures & data
Figure 1. Doxycycline-induced H-RASV12 expression induces cellular senescence in normal BJ human fibroblasts. BJ cells stably transduced with Tet-regulatable H-RASV12 (BJ-Ras) cells were induced by doxycycline (DOX) assayed for senescence using different markers. (a) Cumulative cell growth of BJ-Ras cells induced by DOX or vehicle during a period of 16 days. Cell number at each time point was measured in triplicates. (b) Senescence associated β-GAL (SA-β-GAL) staining of BJ-Ras induced by DOX or vehicle for 4 and 12 days. Right panel; quantification of the percentage of β-GAL stained cells at 16 days after start of treatment. (c) Measurement of cell size by phalloidin staining after treatment with DOX or vehicle for 16 days. Right panel; quantification of cell area. (d) Immunofluorescence staining of H3K9me3 after treatment with DOX or vehicle for 16 days. Right panel; quantification of percentage of H3K9me3-positive cells. (a–d) Cells were split and reseeded every fourth day after treatment if necessary, and were given fresh media containing vehicle or DOX. Statistical data are presented as mean ± SEM, ***p < 0.001.
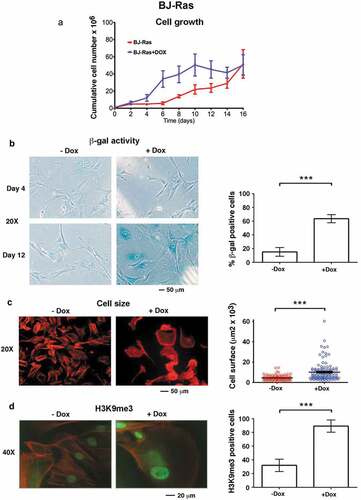
Figure 2. Expression of proteins/genes involved in cell cycle and senescence regulation upon H-RAS induction in BJ-Ras cells. (a) Immunoblot analysis of H-RAS and cyclin A1 after treatment of the cells with DOX or vehicle at indicated time points. (b) Immunoblot analysis of H-RAS, MYC, p21CIP1, phosphorylated pRb, H3K9me3 after treatment with DOX or vehicle at indicated time points. β-actin was used as loading control. (c) RT-qPCR analysis of mRNA expression of H-RAS, p16INK4A, p21CIP1 and p14ARF at day 16 after treatment with DOX or vehicle. Relative fold changes of mRNA expression are presented as mean ± SEM, **p < 0.01, ***p < 0.001. (a–c) The cells were split and reseeded during the experiments as described in Materials and Methods and in the legend to .
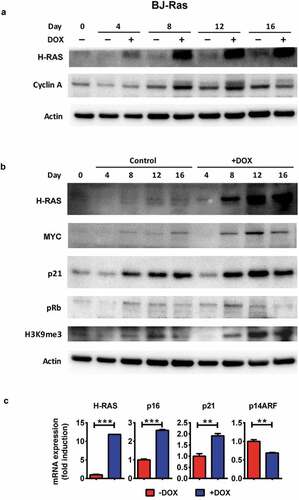
Figure 3. Establishment of BJ and BJ-Ras sublines expressing the 4-OH-tamoxifen regulatable MycER vector (BJ-MycER and BJ-Ras/MycER cells, respectively). (a) Immunoblot analysis of MycER protein expression (upper band) in selected BJ-MycER and BJ-Ras/MycER clones. U2OS osteosarcoma cells expressing the MycER construct was used as control. (b) RT-qPCR analysis of mRNA expression of MYC target genes after the cells were serum starved for 24 hrs and subsequently treated with either with 100 or 200 nM 4-OH-tamoxifen (OHT) for another 24 hrs. Relative fold change of mRNA expression is displayed as mean ± SEM, *p < 0.05, **p < 0.01, ***p < 0.001.
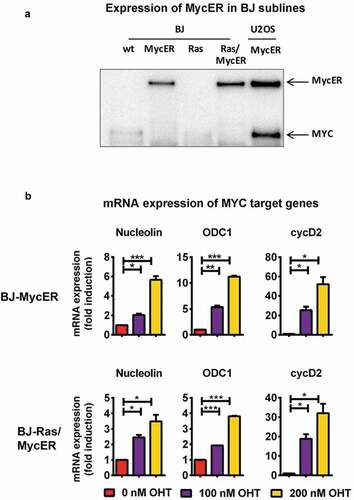
Figure 4. Combined activation of MYC and RAS in BJ-Ras/MycER cells does not rescue cells from RAS-induced senescence or MYC-induced apoptosis. BJ-Ras/MycER cells were treated with DOX (2 µg/ml), OHT (200 nM), DOX (2 µg/ml) + OHT (200 nM) or vehicle for 8 days (a, b, c, d and f) or 16 days (e). Assays were performed in triplicates. (a) Cumulative cell growth of BJ-Ras/MycER cells induced by indicated treatments as determined by trypan blue staining. (b) Measurement of cell death by trypan blue exclusion. (c) Immunoblot analysis of expression of cyclin A1, cleaved PARP (cPARP), p53, γH2AX, H3K9me3 and p16 as indicated. Note that the PARP1 antibody used (#9546) is specific for cleaved PARP. (d) Measurement of the percentage of S-phase cells by EdU incorporation assay using fluorescence microscopy. (e) SA-β-GAL assay performed at day 16 after indicated treatments. (f) Immunoblot analysis of expression of MYC, MycER, H-RAS, ERK, AKT and phosphorylated forms of these proteins as indicated. (c,f) Note that the immunoblots in (c) and (f) are from the same experiment. The actin loading control for both panels is provided in (c). (a–f) The cells were split and reseeded during the experiments as described in Materials and Methods and in the legend to . Statistical data are presented as mean ± SEM, *p < 0.05, **p < 0.01, ***p < 0.001.
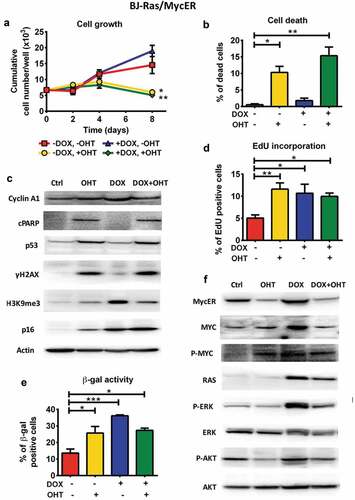
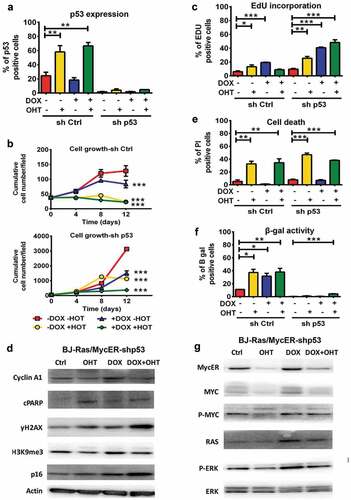
Figure 5. Depletion of p53 does not abrogate apoptosis after activation of MYC ± RAS in BJ-Ras/MycER-shp53 cells. BJ-Ras/MycER-shp53 and BJ-Ras/MycER-shCtrl cells were treated with DOX (2 µg/ml), OHT (100 nM), DOX (2 µg/ml) + OHT (100 nM) or vehicle for 16 days (b, g) or 8 days (c, e, f, h) as indicated. Assays were performed in triplicates. (a) Estimation of the percentage p53 positive cells in BJ-Ras/MycER-shp53 and BJ-Ras/MycER-shCtrl cultures after indicated treatments using fluorescence microscopy. (b) Growth of BJ-Ras/MycER-shCtrl and BJ-Ras/MycER-shp53 cells induced by indicated treatments during a period of 12 days by DAPI staining per field using fluorescence microscopy. (c) Measurement of the percentage of S-phase cells by EdU incorporation assay using fluorescence microscopy at day 8. (d) Immunoblot analysis of expression of proteins involved in the cell cycle, apoptosis, DNA damage and senescence (see legend to ) as indicated. (e) Measurement of cell death by propidium iodide staining at day 8. (f) SA-β-GAL assay was performed at day 16 after indicated treatments. (g) Immunoblot analysis of expression of MYC, RAS, ERK and phosphorylated forms of these proteins as indicated. d, g) Note that the immunoblots in (d) and (g) are from the same experiment. The actin loading control for both panels is provided in (d). (a–h) The cells were split and reseeded during the experiments as described in Materials and Methods and in the legend to . Statistical data are presented as mean ± SEM, *p < 0.05, **p < 0.01, ***p < 0.001.