Figures & data
Figure 1. miR-300 is generally downregulated in bladder cancer tissue. (a) The relative expression levels of miR-300 in T24, UM-UC3 and SV-HUC-1 cells was confirmed by qRT-PCR. (b) The relative expression levels of miR-300 in ten pairs of bladder cancer patient tissue were confirmed by qRT-PCR. (c) The relative expression levels of miR-300 were significantly upregulated after treatment of demethylation agent 5-aza-CdR in UM-UC3 cells. Error bars represent the S.D. obtained from three independent experiments; *P < 0.05. (d) miR-300 was significantly downregulated in BCa tissues than adjacent para-tumor tissues in TMA with CISH method; *P < 0.05. (e) Representative graph of BCa tissues and adjacent para-tumor tissues in TMA with CISH method. (f) Kaplan-Meier survival analysis revealed that upregulation of miR-300 was significantly associated with high overall survival rate of BCa.
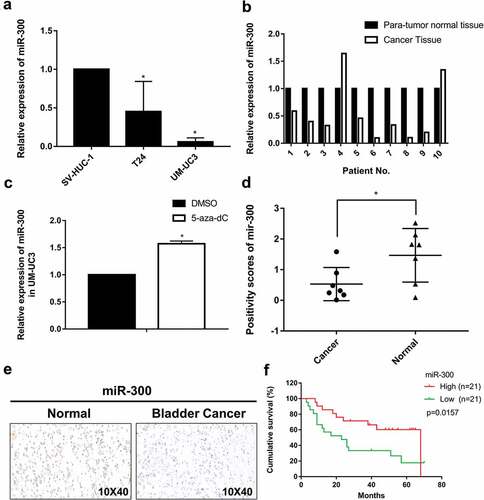
Figure 2. miR-300 significantly inhibits the migration of bladder cancer cells. T24 and UM-UC3 cells were transfected by miR-300 mimics or NC (50 nM). (a) The representative micrographs of trans-well assays in T24 and UM-UC3 cells after transfection. Photographs of trans-well assays were obtained under 20× objective. (b) The representative micrographs of trans-well assays were calculated. Error bars represent the S.D. obtained from three independent experiments; *P < 0.05. (c) The wound healing assay revealed a significant inhibition of T24 cell mobility. (d) The Western blot assay confirmed downregulation of MMP9 at protein level in T24 and UM-UC3 cell lines.
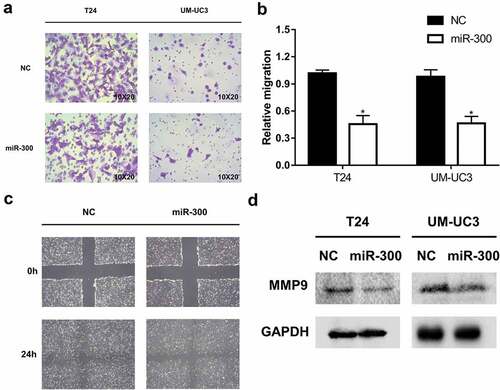
Figure 3. SP1 is a direct target of miR-300. (a-b) A significant downregulation of SP1 was detected by qRT-PCR assay in T24 and UM-UC3 cell lines after overexpression of miR-300. (c) The Western blot assay revealed that miR-300 significantly repressed protein expression of SP1. (d) A Dual-luciferase reporter assay demonstrated that miR-300 significantly inhibited the luciferase activity of vectors carrying 3ʹ-UTR of SP1 in T24 cells. Error bars represent the S.D. obtained from three independent experiments; *P < 0.05. (e) The directly binding sites of miR-300 in the 3ʹUTR of SP1 were mutated as presented.
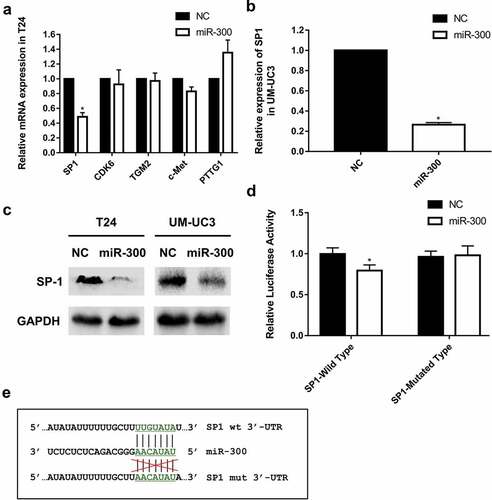
Figure 4. Small interference RNAs were used to knockdown SP1 and a significant inhibition of bladder cancer migration was detected. (a) The data of online database indicates that SP1 is significantly higher expressed in bladder cancer than normal bladder mucosa (p = 0.018, significantly). (b) The knockdown efficiency of each siRNA was determined by qRT-PCR assay. Error bars represent the S.D. obtained from three independent experiments; *P < 0.05. (c) The Western blot assay confirmed downregulation of SP1 and MMP9 at protein levels in T24 and UM-UC3 cells. (d) The representative micrographs of trans-well assay in T24 and UM-UC3 cells after transfected with siRNAs of SP1. Photographs of trans-well assay were obtained under 20× objective. (e) The representative micrographs of trans-well assay were calculated. (f) The wound healing assay revealed a significant inhibition of T24 cell mobility. (g) A ChIP assay revealed that the transcription factor SP1 specifically binds to the promoter zone of MMP9. (h) A sketch outlined the mechanism of SP1 specifically binding to the promoter zone of MMP9.
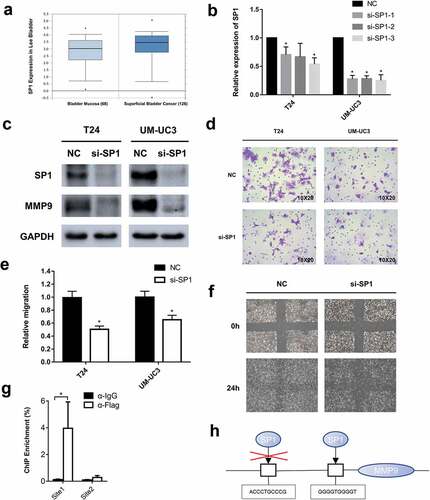
Figure 5. Overexpression of SP1 partially rescued the miR-300-inhibited mobility of BCa cells. T24 and UM-UC3 cells were co-transfected with pSP1 or vector and miR-300 mimics or NC as displayed. (a) The qRT-PCR assays determined the expression of SP1 at mRNA levels after co-transfection. (b) The Western blot assay confirmed the protein levels of SP1 expression was consistent with qRT-PCR assay. (c) The wound healing assay revealed that the miR-300-induced cell mobility repression was partially rescued by SP1 overexpression. (d) The trans-well assay indicated a consistent trend with the aforesaid assays. (e-f) The relative migration rate of T24 and UM-UC3 cells were calculated. Error bars represent the S.D. obtained from three independent experiments; *P < 0.05.
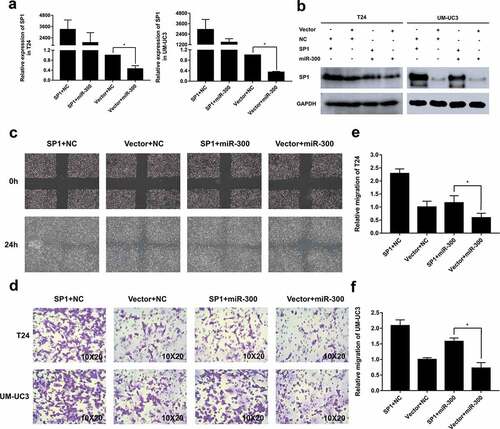
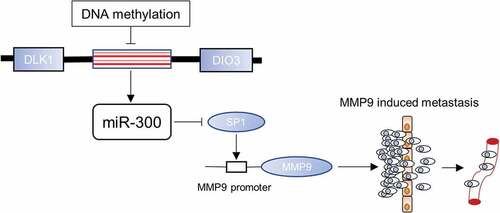
Figure 6. miR-300 mediates the SP1/MMP9 pathway in BCa. The mechanism sketch represents the inhibited mobility of BCa cells via the miR-300/SP1/MMP9 pathway and the dysregulation of miR-300 by DNA methylation.