Figures & data
Table 1. Demographics of the study participants
Table 2. Specific circRNA primers used for quantitative RT-PCR analysis
Figure 1. Differential expression of circRNAs and mRNAs in MPE and TPE. (a, b) Hierarchical clustering analysis of differentially expressed circRNAs (a) and mRNAs (b) between MPE group and TPE group; each group included three individuals (FC (absolute value) ≥ 2.0, P < 0.05). Each column represents one sample, and each row represents a transcript. “Red” indicates high relative expression, and “Green” indicates low relative expression. (c, d) Volcano plots showing differentially expressed circRNAs (c) and mRNAs (d) in MPE. Red and green points represent up-regulated and down-regulated transcripts in MPE, respectively (FC (absolute value) ≥ 2.0, P < 0.05). MPE, Malignant Pleural Effusion; TPE, Tuberculous Pleural Effusion.
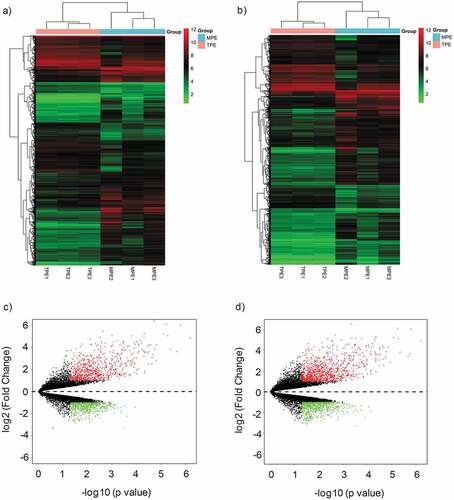
Figure 2. Characterizations of circRNAs and mRNAs expression in MPE compared with TPE. (a) Pie chart of aberrantly expressed circRNAs and mRNAs in MPE. (b) The distribution of differentially expressed circRNAs in human chromosomes. MPE, Malignant Pleural Effusion; TPE, Tuberculous Pleural Effusion.
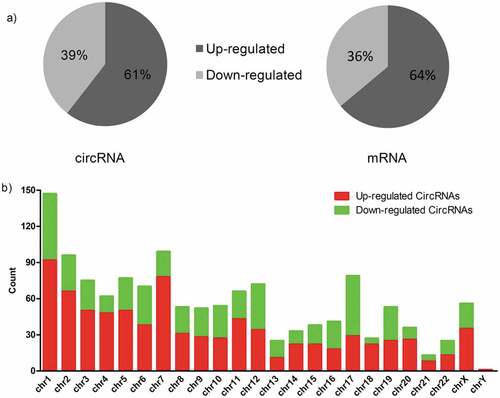
Figure 3. GO and KEGG analysis of differentially expressed mRNAs in MPE. (a, b) GO annotation of up-regulated (a) and down-regulated (b) mRNAs. BP, biological process; CC, cellular component; MF, molecular function. (c, d) KEGG pathway enrichment analysis for up-regulated (c) and down-regulated (d) mRNAs. The related pathways were ranked according to GeneRatio (Selection Counts/Selection Size).
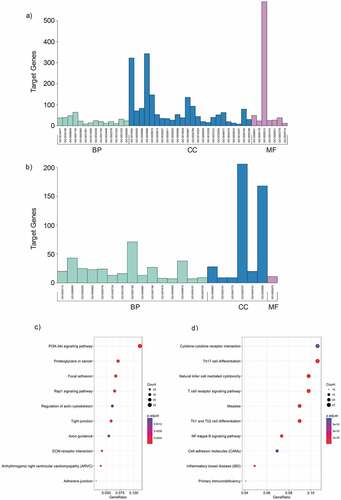
Figure 4. The principle component analysis (PCA) on the microarray data. (a) PCA was performed on the differentially expressed circRNAs obtained from microarray data. The MPE samples can be separated from the TPE samples. (b) PCA plot of the differentially expressed mRNAs.
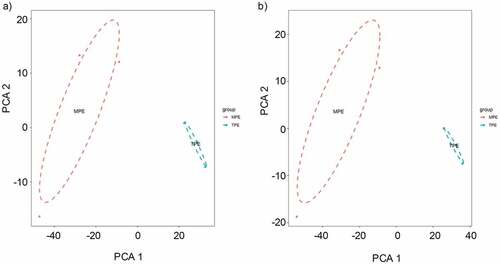
Figure 5. Validation of differentially expressed candidate circRNAs. The expression levels of circRNAs were detected using qRT-PCR. (a) Validation of the expression of has_circ_0001554 and has_circ_0004086. The heights of the columns represent the fold change (MPE/TPE) computed from the microarray data and the qPCR. (b, c, d, e, f) Validation of the expression of hsa_circ_0067705, hsa_circ_0025542, hsa_circ_0085386, hsa_circ_0072793, and hsa_circ_0084927. CircRNA expression was quantified using the 2−(ΔCt MPE – ΔCt TPE) method with normalization to 18SrRNA expression levels. Values are expressed as the mean ± SEM (n = 9). qRT-PCR, quantitative reverse transcription real-time polymerase chain reaction; SEM, standard error of the mean; MPE, Malignant Pleural Effusion; TPE, Tuberculous Pleural Effusion; ND, non-detected.
Table 3. The top 5 up-regulated circRNAs targeted circRNA-miRNA-mRNA network
Figure 6. GO and KEGG analysis of the top 5 up-regulated circRNA targeted mRNAs. (a) GO enrichment for targeted mRNAs. All significant enriched GO terms were listed. (b) KEGG pathway enrichment for targeted mRNAs. Top 10 significant enriched pathway terms were listed.
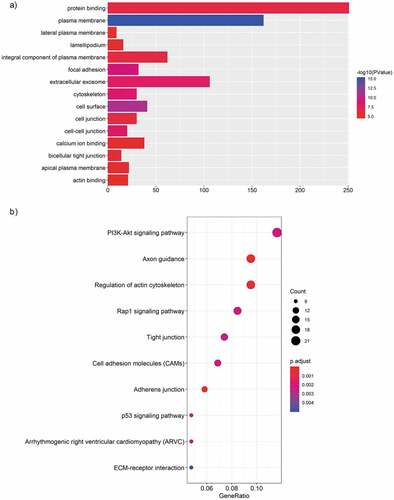
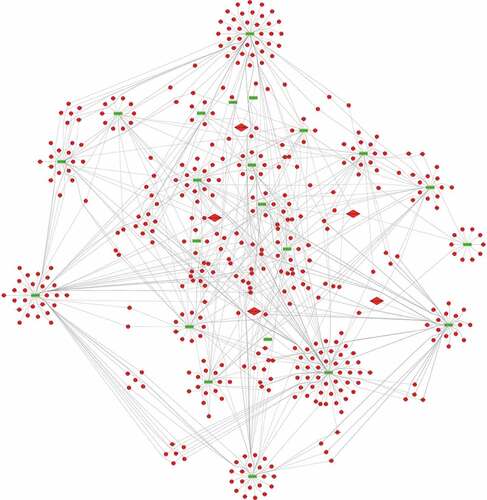
Figure 7. The circRNA-miRNA-mRNA network. 23 miRNA and 675 genes were targeted by the top 5 significantly up-regulated circRNAs. Diamond, circRNA; Rectangle, miRNA; Ellipse, mRNA; Red, up-regulated, Fold Change (FC) ≥ 2.0 and p-value < 0.05; Green, down-regulated, FC≤-2.0 and p-value < 0.05.